Download presentation
Presentation is loading. Please wait.

1
Determinants of Economic Growth of Russian Regions O. Lugovoy The Institute for the Economy in Transition In collaboration with: I. Mazayev, D. Fomchenko, V. Dashkeyev (IET) E. Polyakov (The World Bank) The 2007 Meeting of The AAG, April 19 2007, 3457, San Francisco, CA A. Hecht Wilfrid Laurier University
 E. Polyakov (The World Bank) The 2007 Meeting of The AAG, April , 3457, San Francisco, CA A. Hecht Wilfrid Laurier University.")
2
Addressed questions: What are the fundamental causes of regional disparities? Why do growth rates differ across Russian regions? Is there an income convergence?

5
I. Differences in Income and Growth Rates ‘Deep’ Determinants

6
D. Rodrik’s proximate and deep determinants Source: D. Rodrik, ‘Search of Prosperity’, 2003, p. 5, Figure 1.3

7
“Fundamental Causes” in income differences (according to D. Acemoglu, S. Johnson, J. Robinson, 2005) Economic institutions Geography Culture
 Economic institutions Geography Culture.")
8
“Proximate” determinants (endogenous) Capital deepening (K) Human capital accumulation (L, H) Productivity (A) Natural resources (R) Benchmark production function: Y = A·K ·(H·L) 1- ·(1+R) y = a+r+ · k+(1- ) · h
 Capital deepening (K) Human capital accumulation (L, H) Productivity (A) Natural resources (R) Benchmark production function: Y = A·K ·(H·L) 1- ·(1+R) y = a+r+ · k+(1- ) · h")
9
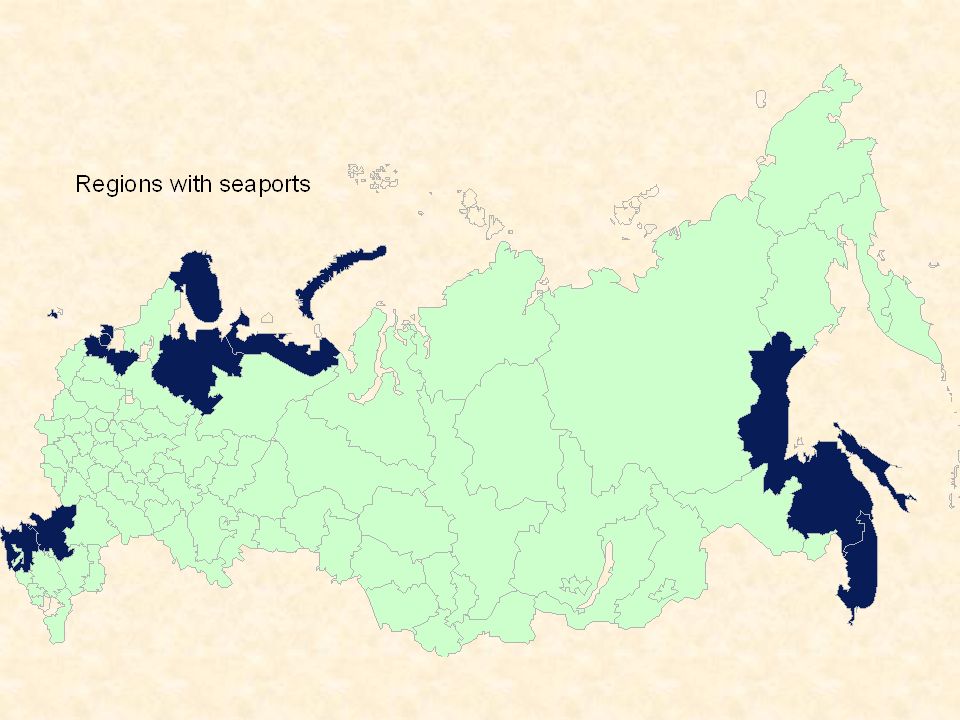
“Deep” determinants of regional growth Physical geography: temperature, permafrost, distribution of natural resource deposits Economic geography (Infrastructure and trade) access to seaports, railway infrastructure, innovation diffusion, agglomeration) Institutions (indexes of corruption and trust, financial ratings and proxy variables)
 access to seaports, railway infrastructure, innovation diffusion, agglomeration) Institutions (indexes of corruption and trust, financial ratings and proxy variables)")
10
Simultaneous equations model y = y(k, h, r) dy = y(dk, m, h, r) m = m(y, Geo, Infr, Inst, …) dk = k(y, Geo, Infr, Inst, …) Geo – Geography Infr – Infrastructure Inst - Institutions
 dy = y(dk, m, h, r) m = m(y, Geo, Infr, Inst, …) dk = k(y, Geo, Infr, Inst, …) Geo – Geography Infr – Infrastructure Inst - Institutions")
11
Econometric techniques Panel data set: 77 regions, 8 years (1997- 2004) Mundlak specification for ‘between’ and ‘within’ estimates 3SLS & FIML for estimation of simultaneous equation model (SEM)
 Mundlak specification for ‘between’ and ‘within’ estimates 3SLS & FIML for estimation of simultaneous equation model (SEM)")
12
Mundlak specification for the one- factor lineal regression model Mundlak specification : or within (Fixed Effect) between (BE)
 between (BE)")
13
D. Rodrik’s proximate and deep determinants Source: D. Rodrik, ‘Search of Prosperity’, p. 5, Figure 1.3

14
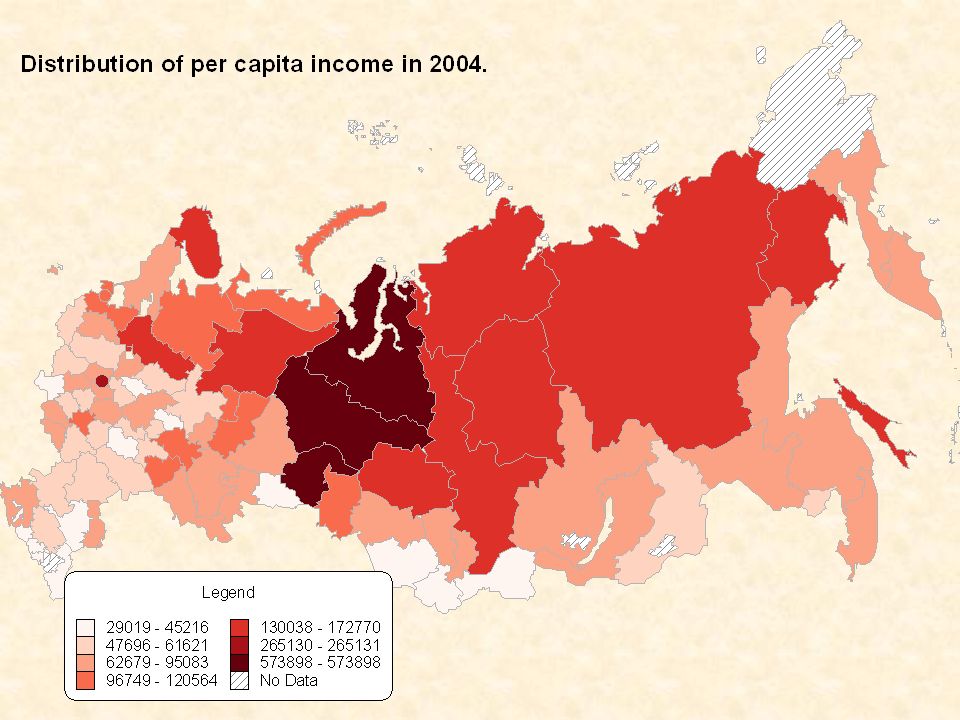
Regions with higher income (GRP p.c.) are characterized by: Relatively higher level of per capita investment; Higher share of raw materials in industrial output (including fuel, ferrous, non-ferrous and timber industries); Higher share of economically active population; Higher share of the employed in economically active population; Increase in share of the employed in economically active population; Higher number of postgraduate students (per 10 th.); Higher agglomeration (population in the largest city).
 are characterized by: Relatively higher level of per capita investment; Higher share of raw materials in industrial output (including fuel, ferrous, non-ferrous and timber industries); Higher share of economically active population; Higher share of the employed in economically active population; Increase in share of the employed in economically active population; Higher number of postgraduate students (per 10 th.); Higher agglomeration (population in the largest city).")
15
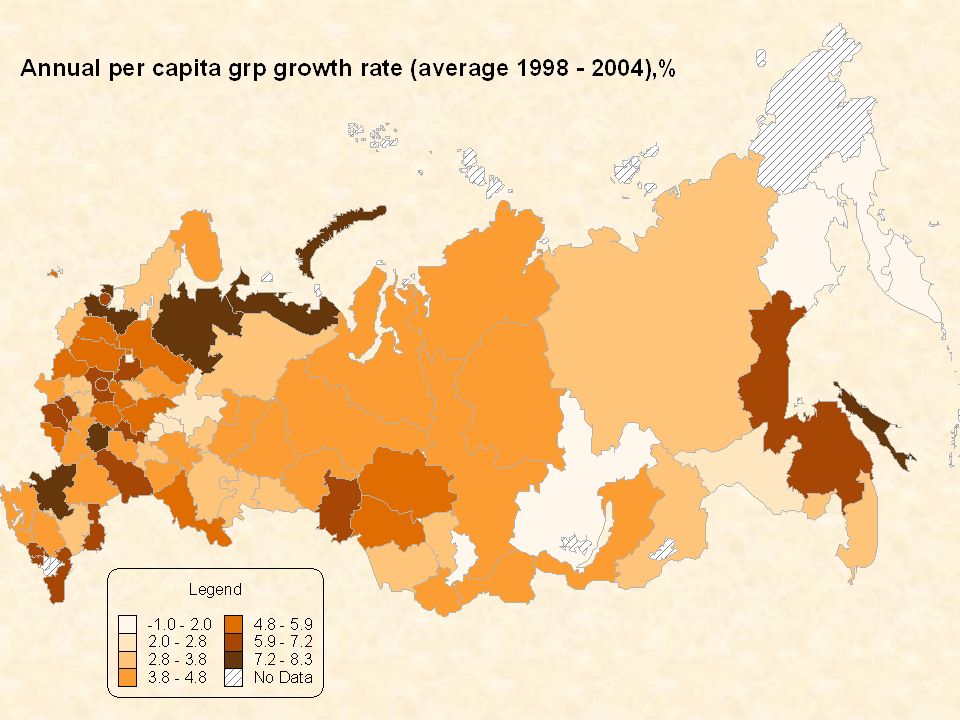
The faster growing regions are characterized by: Relatively higher level of per capita investment; Increase in per capita investment; Increase in the share of raw materials’ industries in industrial output; Availability of a seaport; Lower per capita output level (conditional convergence).
.")
16
The larger migrants’ balance is observed at: Relatively wealthy regions (per capita output, mean over the period); Regions with the smaller population growth rates during the soviet period (early developed regions or “home” regions); Regions with relatively warmer climate (average January temperature); Regions with more developed infrastructure (railway passengers); Regions with higher agglomeration (population in the largest city). Unemployment level (official data) tends to be statistically insignificant.
 tends to be statistically insignificant..")
17
The larger per capita investment is observed in: Regions with higher per capita output, (mean over the period); Regions with relatively warmer climate (average January temperature) on the one side, and regions with permafrost on the other (probably those with field development of natural resources and/or higher costs of investment); Regions with higher per capita fuel industry output; Regions with increase in per capita fuel industry output; Regions with more developed infrastructure (per capita phones in1995); Regions with higher per capita investment during the period 1997-2004 are characterized with less corruption figures concerning small-scale business in 2005.
; Regions with relatively warmer climate (average January temperature) on the one side, and regions with permafrost on the other (probably those with field development of natural resources and/or higher costs of investment); Regions with higher per capita fuel industry output; Regions with increase in per capita fuel industry output; Regions with more developed infrastructure (per capita phones in1995); Regions with higher per capita investment during the period are characterized with less corruption figures concerning small-scale business in 2005.")
18
The larger per capita investment is observed in: “Better” programs of regional development (CEFIR est.) Less legislative risk. S&P rating (dummy variable).
..")
19
Breaking down Economic Growth of Russian Regions (% of variation)
")
20
Growth explained by economic geography (seaports, mineral resource-intensive production, infrastructure)
")
21
Basic conclusions Proximate determinants matter for income level and growth Geography matters for proximate factors accumulation: cause to migration flows and capital accumulation Infrastructure, trade, agglomeration matter for physical and human capital accumulation. There are some statistical evidence of relationship between some institutions measures and ‘proximate’ determinants but the problem of endogenity remains.

22
THANK YOU! lugovoy@iet.ru

27
Physical geography (January means and permafrost margins)
")
28
Economic Geography – Transport infrastructure (Railway traffic intensity)
")
29
Geography – Communication infrastructure (Stationery phones penetration)
")
Similar presentations


 The SGM doesn’t fit facts too well Saving and Investment Don’t.>")


