Download presentation
Presentation is loading. Please wait.

1
The EMEP/EEA Emissions Inventory Guidebook Dr Chris Dore Chair of the TFEIP

2
Contents 1.Accuracy In Emission Inventories 2.Principles of Uncertainty 3.Uncertainty Tools 4.Conclusions 5.Discussion Points

3
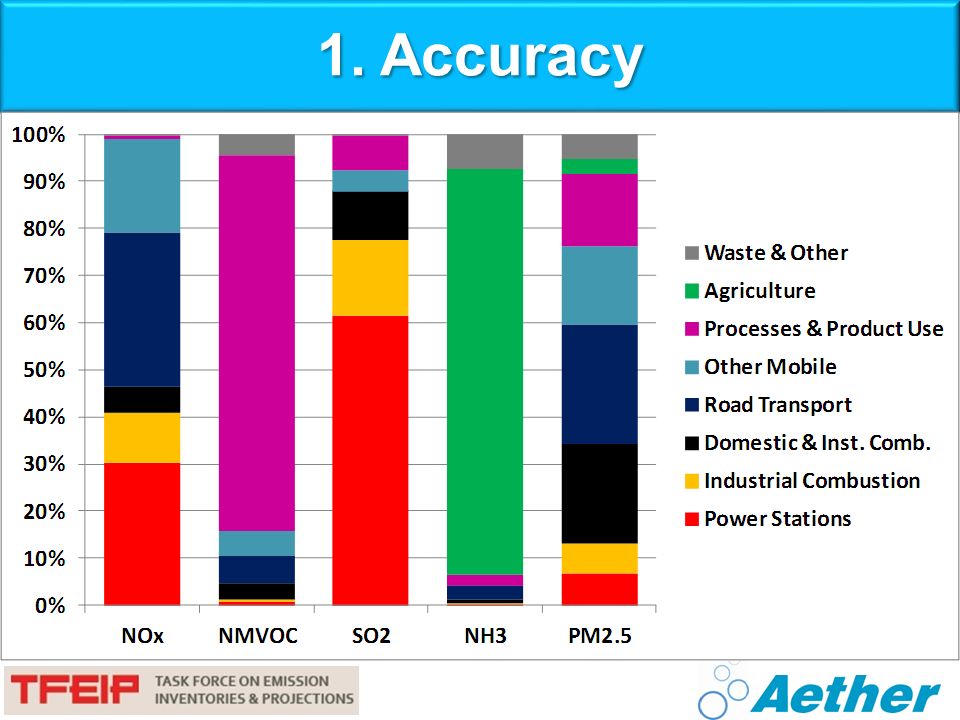
Does it matter?! Actually, it is not very important for demonstrating compliance with targets But key for trying to reflect the real world. 1. Accuracy

4
Some starting considerations… Point sources vs area sources Source/fuel mix Activity data – trends with time vs absolute EFs – variations across time series, applicability Completeness vs guidebook Completeness vs real world Mapping emissions Projections & scenarios 1. Accuracy

6
2. Principles of Uncertainty Uncertainty analysis is generally used to represent “accuracy” Point sources- combination of random independent errors Area sources- one EF, prone to bias.

7
Propagation of Errors Assign uncertainty to AD and EF –from measurement, default ranges, expert judgement “,… root the sum of the squares…” Simple mathematical combination of elements to give an uncertainty for the total emission. 3. Uncertainty Tools (1)
.")
8
Monte-Carlo Analysis 3. Uncertainty Tools (2) Uncertainty profiles, accounts for inter-dependencies... Much better tool, but more challenging to use.
 Uncertainty profiles, accounts for inter-dependencies... Much better tool, but more challenging to use..")
9
Trend Uncertainties Standard tool used for assessing the uncertainty in the trend included in the Guidance. 3. Uncertainty Tools (3)
.")
10
Strengths Methodologies common with GHGs (UNFCCC) Standard mathematical approaches for assessing uncertainty Simple methods available. 3. Uncertainty Tools

11
Weaknesses Low uncertainty does not necessarily mean good accuracy! –incomplete inventory, use of inappropriate EFs etc. Uncertainty ranges applied to EFs are usually no better than a guess! –Not usually enough data points for a statistical analysis Error propagation analysis is too simple –Does not account for interdependencies/biases etc. Modellers want uncertainty on mapped emissions. 3. Uncertainty Tools

12
Development of New Tools Moran’s co-efficient –A mathematical metric of spatial autocorrelation (chess board = -1, random = 0, uniform = +1). –Indicates adjacent grid cell dependencies Uncertainty of mapped emissions 3. Uncertainty Tools

13
Development of New Tools Uncertainty of mapped emissions Combination of emissions uncertainty with mapping uncertainty 3. Uncertainty Tools

14
Learning from the Past 3. Uncertainty Tools

15
Important Considerations EF uncertainties are not robust enough Error propagation analysis - too simple? Uncertainty analysis does not indicate the ability to represent the real world Modellers want uncertainty on mapped emissions. … we need to improve what we are delivering! … and in particular better explain what it represents. 4. Conclusions

16
Some Questions 1.Can we improve current EF uncertainties? 2.Should we all be using Monte-Carlo analysis? 3.Can we add to/adjust uncertainty results to give an indication of real-world representation? 4.Can tools be developed that better provide the information that users need? 5.What resources do we have to support this? 5. Discussion Points

17
THANK-YOU FOR YOUR ATTENTION

Similar presentations


 Center for the Advancement of Population.>")


 l UMAs costs $1000.>")


 Lecture 181 Lecture 18: The Modeling Environment CE 498/698 and ERS 485 Principles of Water Quality Modeling.>")


