Download presentation
Presentation is loading. Please wait.

1
11 th EPIET Epidemiology Course Menorca, October 2 2006 Environmental Epidemiology (introduction) Dr Georges Salines Institut de Veille Sanitaire Département Santé Environnement
 Dr Georges Salines Institut de Veille Sanitaire Département Santé Environnement")
2
I.Objectives To provide a basic knowledge of : The definitions of environmental health, environmental epidemiology, environmental risks The definitions of environmental health, environmental epidemiology, environmental risks The concept of low-risk and the links between relative risk, prevalence of exposure and attributable risk The concept of low-risk and the links between relative risk, prevalence of exposure and attributable risk The limits of epidemiology in environmental health The limits of epidemiology in environmental health How to deal with these limits How to deal with these limits

3
Definitions Epidemiology is the study of the distribution and determinants of health-related states or events in specified populations Epidemiology is the study of the distribution and determinants of health-related states or events in specified populations The environment is all the physical, chemical and biological factors external to a person, and all the related behaviours. (WHO) The environment is all the physical, chemical and biological factors external to a person, and all the related behaviours. (WHO) The environment is the sum of all external conditions affecting the life, development and survival of an organism (US EPA) The environment is the sum of all external conditions affecting the life, development and survival of an organism (US EPA) The environment is everything that is not me (Einstein) The environment is everything that is not me (Einstein)
 The environment is all the physical, chemical and biological factors external to a person, and all the related behaviours. (WHO) The environment is the sum of all external conditions affecting the life, development and survival of an organism (US EPA) The environment is the sum of all external conditions affecting the life, development and survival of an organism (US EPA) The environment is everything that is not me (Einstein) The environment is everything that is not me (Einstein).")
4
Traditional exclusions Genetics factors (except interactions genes/environment) Genetics factors (except interactions genes/environment) Behaviours (except behaviours modifying exposures) Behaviours (except behaviours modifying exposures) Social factors (except links between SES and physical environment) Social factors (except links between SES and physical environment) Infectious diseases (except those transmitted through exposure to media) Infectious diseases (except those transmitted through exposure to media)
 Genetics factors (except interactions genes/environment) Behaviours (except behaviours modifying exposures) Behaviours (except behaviours modifying exposures) Social factors (except links between SES and physical environment) Social factors (except links between SES and physical environment) Infectious diseases (except those transmitted through exposure to media) Infectious diseases (except those transmitted through exposure to media)")
5
Risk A measure of the probability that damage to life, health, property, and/or the environment will occur as a result of a given hazard (US EPA) Rylander classification RR > = 10 : people themselves recognize the risk RR de 9 à 2 : « comfort zone » for epidemiology RR < 2 : zone where epidemiology reaches its limits...
 Rylander classification RR > = 10 : people themselves recognize the risk RR de 9 à 2 : « comfort zone » for epidemiology RR < 2 : zone where epidemiology reaches its limits...")
6
High risks occupational environment occupational environment aromatic amines and bladder cancer aromatic amines and bladder cancer asbestos fibres and mesothelioma asbestos fibres and mesothelioma cadmium and kidney diseases cadmium and kidney diseases benzene and leukaemia benzene and leukaemia pesticides and infertility pesticides and infertility organic solvents and neurological disorders organic solvents and neurological disorders etc... etc... general environment general environment

7
December 1952 - London

9
1953 - Minamata

10
December 1984 - Bhopal

11
1986 - Tchernobyl

12
Thyroid cancer in children

13
2003 - Paris

14
Mortality and mean temperature in Paris 1999-2002 versus 2003 Peak: Aug 13th

15
2005 - Katrina

16
2006 Abidjan

17
anthropogenic activities anthropogenic activities London 1952 London 1952 Minamata 1953 … Minamata 1953 … natural origin natural origin Heat waves Heat waves hurricanes… hurricanes… mixed origin mixed origin UV and melanoma UV and melanoma tremolite and mesothelioma in New Caledonia tremolite and mesothelioma in New Caledonia erionite and mesothelioma in Turkey... erionite and mesothelioma in Turkey... Nature of high risks in general environment

18
High RR High RR benzidine / bladder cancer RR = 500 benzidine / bladder cancer RR = 500 asbestos / mesotheliomaRR = 50 asbestos / mesotheliomaRR = 50 tobacco (>25g/d) / lung cancer RR = 30 tobacco (>25g/d) / lung cancer RR = 30 Usually severe and often specific health endpoints Usually severe and often specific health endpoints well defined populations well defined populations in space, in time in space, in time socio-demographic characteristics socio-demographic characteristics relatively small populations relatively small populations Characteristics of high risks
 / lung cancer RR = 30 tobacco (>25g/d) / lung cancer RR = 30 Usually severe and often specific health endpoints Usually severe and often specific health endpoints well defined populations well defined populations in space, in time in space, in time socio-demographic characteristics socio-demographic characteristics relatively small populations relatively small populations Characteristics of high risks")
19
urban air pollution and short-term respiratory diseases urban air pollution and short-term respiratory diseases RR = 1.1 - 1.5 RR = 1.1 - 1.5 chlorinated water supplies and bladder cancer chlorinated water supplies and bladder cancer RR = 1.4 RR = 1.4 electromagnetic fields and children leukemia electromagnetic fields and children leukemia RR = 1.3... RR = 1.3... Low risks

20
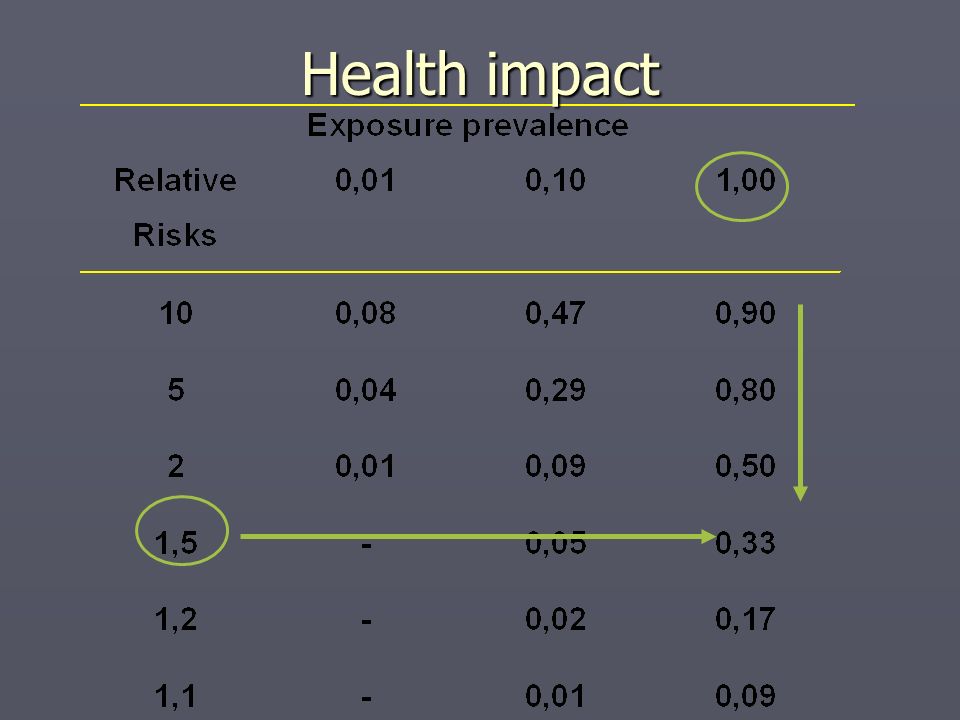
Relative risk and attributable risk Relative risk and attributable risk relative risk relative risk ratio measure : it is an indicator for epidemiologist ratio measure : it is an indicator for epidemiologist attributable risk attributable risk FRA = p * ( RR -1) / [ 1+ p * ( RR - 1) ]if the relation is causal, it estimates the proportion (amount) of diseases that we can attribute to the exposure FRA = p * ( RR -1) / [ 1+ p * ( RR - 1) ]if the relation is causal, it estimates the proportion (amount) of diseases that we can attribute to the exposure Small relative risks do not mean small health impacts
![Relative risk and attributable risk Relative risk and attributable risk relative risk relative risk ratio measure : it is an indicator for epidemiologist ratio measure : it is an indicator for epidemiologist attributable risk attributable risk FRA = p * ( RR -1) / [ 1+ p * ( RR - 1) ]if the relation is causal, it estimates the proportion (amount) of diseases that we can attribute to the exposure FRA = p * ( RR -1) / [ 1+ p * ( RR - 1) ]if the relation is causal, it estimates the proportion (amount) of diseases that we can attribute to the exposure Small relative risks do not mean small health impacts](http://images.slideplayer.com/2/742915/slides/slide_20.jpg "Relative risk and attributable risk Relative risk and attributable risk relative risk relative risk ratio measure : it is an indicator for epidemiologist ratio measure : it is an indicator for epidemiologist attributable risk attributable risk FRA = p * ( RR -1) / [ 1+ p * ( RR - 1) ]if the relation is causal, it estimates the proportion (amount) of diseases that we can attribute to the exposure FRA = p * ( RR -1) / [ 1+ p * ( RR - 1) ]if the relation is causal, it estimates the proportion (amount) of diseases that we can attribute to the exposure Small relative risks do not mean small health impacts")
21
Health impact

23
May be not that low after all low risks or weak associations ? weak associations ?

24
Theoretical baseline situation (the wonderful world) E0 = non exposed, E1=low exposure, E2=high exposure * Incidence : x /100.000, ** RR : true Relative Risk
 E0 = non exposed, E1=low exposure, E2=high exposure * Incidence : x / , ** RR : true Relative Risk")
25
Heterogeneity in the populations sensitivity to the exposure 50% 50% * (S) : high sensitivity. (s) : low sensitivity
 : low sensitivity.")
26
Non specific definition of the health outcome * (D) : disease specifically related to exposure. (d) : disease not related to exposure
 : disease not related to exposure.")
27
Errors in the exposure classification 20% of non exposed (E0) are categorised E1 and 10% of non-exposed are categorised E2. E0E1E2 Prevalence50%35%15% Incidence150214.3250 RR1.01.431.67

28
Inaccuracy in the exposure categories E0E1 Prevalence50% Incidence150225 RR1.01.5

29
Epidemiology and weak associations Improve data quality Improve data quality exposure exposure health endpoints health endpoints co-factors co-factors Improve statistical power Improve statistical power Meta-analysis & Multi centres Meta-analysis & Multi centres Ecological designs Ecological designs

30
appropriate selection of sources and routes of exposure appropriate selection of sources and routes of exposure taking account: taking account: critical periods of exposure critical periods of exposure individual history of exposure : behaviour, space- time activities … individual history of exposure : behaviour, space- time activities … Improving assessment of exposure: better use of environmental data

31
Lynch et al, Arch Env Health 1989;44(4):252-259 Example
: Example")
32
Example (2)
")
33
technical, logistical and financial limits … technical, logistical and financial limits … depends on sensibility / specificity of the method depends on sensibility / specificity of the method Improving assessment of exposure: personal exposure monitoring

34
cellular, biochemical, molecular alterations cellular, biochemical, molecular alterations measurable in biological media (human tissues, cells or fluids) measurable in biological media (human tissues, cells or fluids) advantages advantages measurement of a dose (effectively absorbed) measurement of a dose (effectively absorbed) integration of all the routes of exposure and sources of absorption integration of all the routes of exposure and sources of absorption avoids subjects lack of knowledge, memory failure, biased recall, deliberate misinformation … avoids subjects lack of knowledge, memory failure, biased recall, deliberate misinformation … limits limits costs costs Representativity of a single sample taken at a particular time Representativity of a single sample taken at a particular time In some cases, route of exposure is of the essence In some cases, route of exposure is of the essence Improving assessment of exposure: biomarkers of exposure
 measurable in biological media (human tissues, cells or fluids) advantages advantages measurement of a dose (effectively absorbed) measurement of a dose (effectively absorbed) integration of all the routes of exposure and sources of absorption integration of all the routes of exposure and sources of absorption avoids subjects lack of knowledge, memory failure, biased recall, deliberate misinformation … avoids subjects lack of knowledge, memory failure, biased recall, deliberate misinformation … limits limits costs costs Representativity of a single sample taken at a particular time Representativity of a single sample taken at a particular time In some cases, route of exposure is of the essence In some cases, route of exposure is of the essence Improving assessment of exposure: biomarkers of exposure")
35
outcomes specified as precisely as possible outcomes specified as precisely as possible subgroups of disease subgroups of disease biomarkers of effects biomarkers of effects sub clinical events sub clinical events predictive value ? predictive value ? variability variability biological, laboratory-related, logistical issues (bias) biological, laboratory-related, logistical issues (bias) Improving assessment of health endpoints
 biological, laboratory-related, logistical issues (bias) Improving assessment of health endpoints.")
36
as much attention as exposure and disease variables as much attention as exposure and disease variables Biomarkers of susceptibility Biomarkers of susceptibility Measuring confounders and effect modifiers

37
Bell D.A. J Nat Cancer Inst 1993;85(14):1159-64 Example
: Example")
38
Increasing sample size Increasing sample size Improving statistical power 0 5000 10000 15000 20000 1,11,21,31,41,51,61,71,81,92 Odds ratio Number of cases and controls (1/1) for 1- = 80%, = 5%, H0: OR=1
 for 1- = 80%, = 5%, H0: OR=1")
39
Mammoth studies Mammoth studies Expansive Expansive Complex Complex Pooling data Pooling data Meta-analysis (or combined analysis) Meta-analysis (or combined analysis) Multi centres studies Multi centres studies heterogeneity ? heterogeneity ? Improving statistical power

40
Ecological studies : principle Agregated data Statistical unit = « group » Group exposure Mean exposure, environmental proxy Group effect Frequency of disease in the statistical unit, SIR, SMR

41
Avantages of Ecological studies Wider exposure contrasts may be found between populations than between individuals within the same population Large number of observations Statistical power Use of existing data rapid Cost-effective

42
Geographical studies Statistical units = geographical areas Exposure levels : E1, E2, …, Ei Prevalence or incidence levels: M1, M2, …., Mi Resarch of an association between : Variations of exposure levels Variation of health indicators

43
Limits: Biases and fallacies Classification Surveillance Selection « Ecological fallacy »

44
Classification errors Often non differential = Risk dilution toward 1 (bias toward false negative) E E M M
 E E M M")
45
Surveillance bias Vicinity of a Nuclear Plant Leukemia Register « Non exposed » Zone All cancers Register Often differential: bias toward false positive (if better sensitivity) or toward false negative (if better specificity)
 or toward false negative (if better specificity)")
46
Selection Bias Example 1: Texas Sharpshooter (Bias toward false positive) Example 2: Flight of the sick people (Bias toward false negative)
 Example 2: Flight of the sick people (Bias toward false negative)")
47
Ecological Fallacy in Geographical study Environmental exposure Area B Area C Area A Incidence rate

48
Ecological Fallacy population B population C population A Individual exposure Incidence rate

49
Example 1983: leukaemia cluster among children living near the Sellafield nuclear waste reprocessing plant (United Kingdom) 1983: leukaemia cluster among children living near the Sellafield nuclear waste reprocessing plant (United Kingdom) Other leukaemia clusters have since been identified near other nuclear sites, such as Dounreay in Scotland and Krümmel in Germany Other leukaemia clusters have since been identified near other nuclear sites, such as Dounreay in Scotland and Krümmel in Germany
 1983: leukaemia cluster among children living near the Sellafield nuclear waste reprocessing plant (United Kingdom) Other leukaemia clusters have since been identified near other nuclear sites, such as Dounreay in Scotland and Krümmel in Germany Other leukaemia clusters have since been identified near other nuclear sites, such as Dounreay in Scotland and Krümmel in Germany")
50
But… In view of current knowledge about the relation between exposure to radiation and the risk of leukemia, dose levels around nuclear sites are incompatible with the excess risks observed … In view of current knowledge about the relation between exposure to radiation and the risk of leukemia, dose levels around nuclear sites are incompatible with the excess risks observed … Studies considering several sites (United Kingdom, France, USA, Germany, Canada, Japan, Sweden, Spain) have not detected any global excess Studies considering several sites (United Kingdom, France, USA, Germany, Canada, Japan, Sweden, Spain) have not detected any global excess Leukaemia clusters have been observed in areas far from any nuclear site Leukaemia clusters have been observed in areas far from any nuclear site There are alternative hypotheses which may explain the leukaemia clusters located near some nuclear sites There are alternative hypotheses which may explain the leukaemia clusters located near some nuclear sites
 have not detected any global excess Studies considering several sites (United Kingdom, France, USA, Germany, Canada, Japan, Sweden, Spain) have not detected any global excess Leukaemia clusters have been observed in areas far from any nuclear site Leukaemia clusters have been observed in areas far from any nuclear site There are alternative hypotheses which may explain the leukaemia clusters located near some nuclear sites There are alternative hypotheses which may explain the leukaemia clusters located near some nuclear sites")
51
Interpretation of geographical studies Measures of geographical associations Very difficult to extrapolate at the individual level Causality generaly out of reach of those designs Useful for generating hypotheses

52
Time series Statistical power Statistical power Control of confounding factors +++ Control of confounding factors +++ Non time-dependant: Population is its own control Non time-dependant: Population is its own control Time-dependant: modelling techniques Time-dependant: modelling techniques

53
Exemple PSAS9 I D day Exposed population Indicator of exposure Indicator of effect All people living in Marseilles SO2 g/m 3 (Daily mean of 3 monitoring stations) Daily number of deaths Source : Surveillance épidémiologique air et santé, rapport InVS, mars 1999
 Daily number of deaths Source : Surveillance épidémiologique air et santé, rapport InVS, mars 1999")
54
Raw curves Mean levels of air pollution Marseilles, 1990-1995 Daily counts of deaths, Marseilles, 1990- 1995 Source : Surveillance épidémiologique air et santé, rapport InVS, mars 1999

55
Time-dependant counfounding factors Fonction totale. Source : Surveillance épidémiologique air et santé, rapport InVS, mars 1999 Serial correlation fonction of daily mortality

56
Time-dependant counfounding factors Risk factor Health outcome Confounding factor Daily variation of air pollution levels Daily variation of number of deaths from respiratory causes Daily variations of weather Filleul et coll., Rev. Mal. Respir., 2001

57
Non time-dependant counfounding factors Risk factor Health outcome Confounding factor Daily variation of air pollution levels Daily variation of number of deaths from respiratory causes Tobacco Filleul et coll., Rev. Mal. Respir., 2001

58
Modeling: Strip-tease of the curves Taking into acount long-term trends (ie:decrease of mortality) Taking into acount long-term trends (ie:decrease of mortality) Taking into acount seasonal variations (Higher mortality during winter) Taking into acount seasonal variations (Higher mortality during winter) Taking into acount the day of the week Taking into acount the day of the week Taking into acount co-factors (Meteorological data, Flu epidemics, Pollinic data...) Taking into acount co-factors (Meteorological data, Flu epidemics, Pollinic data...)
 Taking into acount long-term trends (ie:decrease of mortality) Taking into acount seasonal variations (Higher mortality during winter) Taking into acount seasonal variations (Higher mortality during winter) Taking into acount the day of the week Taking into acount the day of the week Taking into acount co-factors (Meteorological data, Flu epidemics, Pollinic data...) Taking into acount co-factors (Meteorological data, Flu epidemics, Pollinic data...)")
59
Long-term trends Predicted value of total mortality by trend-modeling. Source : Surveillance épidémiologique air et santé, rapport InVS, mars 1999

60
Seasonal variations Predicted value of mortality by modelization of seasonal variations Source : Surveillance épidémiologique air et santé, rapport InVS, mars 1999

61
Meteorological data Naperian Logarithm of Relative Risk of the interaction temperature-humidity on total mortality Source : Surveillance épidémiologique air et santé, rapport InVS, mars 1999

62
Day of the week Predicted value of total mortality by modelization of a « day of the week & holidays» effect Source : Surveillance épidémiologique air et santé, rapport InVS, mars 1999

63
Full Monty Serial correlation fonction of daily mortality after modelization of trend, seasonal variatipons, Flu epidemics, temperature, humidity, day of the week & holidays Residual values of total mortality after modelization of trend, seasonal variatipons, Flu epidemics, temperature, humidity, day of the week & holidays Source : Surveillance épidémiologique air et santé, rapport InVS, mars 1999

64
Result dose-response curve of total mortality in relation to SO2 levels Source : Surveillance épidémiologique air et santé, rapport InVS, mars 1999

65
Interpretation of time-series studies Establishing causation is possible after a careful discussion of Hill criteria Establishing causation is possible after a careful discussion of Hill criteria 1.Strength. 2.Consistency. 3.Specificity. 4.Temporality. 5.Biological gradient (dose-response). 6.Plausibility. 7.Coherence. 8.Experiment. 9.Analogy.
. 6.Plausibility. 7.Coherence. 8.Experiment. 9.Analogy..")
66
V. Conclusion Aspects of the study design that involves measurements of variables are critical, especially in environmental epidemiology where risks from exposure are likely to be small, difficult to detect, and perhaps not clinically significant, yet maybe of public health importance Aspects of the study design that involves measurements of variables are critical, especially in environmental epidemiology where risks from exposure are likely to be small, difficult to detect, and perhaps not clinically significant, yet maybe of public health importance Epidemiology is not always the only answer of even the more relevant one to questions submitted to environmental epidemiologists: Risk analysis for example, is a very useful and cost- effective method Epidemiology is not always the only answer of even the more relevant one to questions submitted to environmental epidemiologists: Risk analysis for example, is a very useful and cost- effective method...but this is another story....but this is another story.

Similar presentations


 Helen Maguire HPA London region with acknowledgement.>")


>")


, and the other of people with the same general characteristics.>")


