Download presentation
Presentation is loading. Please wait.

1
Guidelines for Assessment and Instruction in Statistics Education A Curriculum Framework for Pre-K-12 Statistics Education The GAISE Report (2007) The American Statistical Association http://www.amstat.org/education/gaise/ Christine Franklin & Henry Kranendonk NCSM Conference March 19, 2007 http://www.amstat.org/education/gaise/
 The American Statistical Association Christine Franklin & Henry Kranendonk NCSM Conference March 19,")
2
Outline of PresentationOverview of the GAISE ReportThe Evolution of a Statistical Concept - The Mean as Fair Share/Variation from Fair Share - The Mean as the Balance Point/Variation from the Mean - The Sampling Distribution of the Mean/Variation in Sample MeansSummary

3
Benchmarks in Statistical Education in the United States (1980-2007) The Quantitative Literacy Project (ASA/NCTM Joint Committee, Early 1980’s) Curriculum and Evaluation Standards for School Mathematics (NCTM, 1989) Principles and Standards for School Mathematics (NCTM, 2000) Mathematics and Statistics College Board Standards for College Success (2006) The GAISE Report (2005, 2007)
 The Quantitative Literacy Project (ASA/NCTM Joint Committee, Early 1980’s) Curriculum and Evaluation Standards for School Mathematics (NCTM, 1989) Principles and Standards for School Mathematics (NCTM, 2000) Mathematics and Statistics College Board Standards for College Success (2006) The GAISE Report (2005, 2007)")
4
GOALS of the GAISE Report Promote and develop statistical literacy Provide links with the NCTM Standards Discuss differences between Mathematics and Statistics* Clarify the role of probability in statistics* Illustrate concepts associated with the data analysis process* Present the statistics curriculum for grades Pre-K-12 as a cohesive and coherent curriculum strand* Provide developmental sequences of learning experiences*

5
Stakeholders Writers of state standards Writers of assessment items Curriculum directors Pre K-12 teachers Educators at teacher preparation programs

6
STATISTICAL THINKING versus MATHEMATICAL THINKING The Focus of Statistics on Variation in Data The Importance of Context in Statistics

7
PROBABILITY Randomization Sampling -- "select at random from a population" Experiments -- "assign at random to a treatment"

8
THE FRAMEWORK Underlying Principles PROBLEM SOLVING PROCESS Formulate Questions clarify the problem at hand formulate one (or more) questions that can be answered with data Collect Data design a plan to collect appropriate data employ the plan to collect the data Analyze Data select appropriate graphical or numerical methods use these methods to analyze the data Interpret Results interpret the analysis taking into account the scope of inference based on the data collection design relate the interpretation to the original question
 questions that can be answered with data Collect Data design a plan to collect appropriate data employ the plan to collect the data Analyze Data select appropriate graphical or numerical methods use these methods to analyze the data Interpret Results interpret the analysis taking into account the scope of inference based on the data collection design relate the interpretation to the original question")
9
Developmental LevelsThe GAISE Report proposes three developmental levels for evolving statistical concepts. Levels A, B, and C

10
The Framework Model A Two-Dimensional ModelOne dimension is the four components of the statistical problem-solving process, along with the nature of and the focus on variabilityThe second dimension is comprised of three developmental levels (A, B, and C)
")
11
THE FRAMEWORK MODEL Process Component Level ALevel BLevel C Formulate Question Beginning awareness of the statistics question distinction Increased awareness of the statistics question distinction Students can make the statistics question distinction Collect Data Do not yet design for differences Awareness of design for differences Students make designs for differences Analyze Data Use particular properties of distributions in context of specific example Learn to use particular properties of distributions as tools of analysis Understand and use distributions in analysis as a global concept Interpret Results Do not look beyond the data Acknowledge that looking beyond the data is feasible Able to look beyond the data in some contexts

12
THE FRAMEWORK MODEL Nature of Variability Focus on Variability Measurement variability Natural variability Induced variability Variability within a group Sampling variability Variability within a group and variability between groups Co-variability Chance variability Variability in model fitting

13
Activity Based LearningThe GAISE Report promotes active learning of statistical content and concepts Two Types of Learning ActivitiesProblem Solving ActivitiesConcept Activities

14
The STN article illustrates a Problem Solving Activity across the three developmental levels.

15
The evolution of a statistical concept --What is the mean?Quantifying variation in data from the mean

16
Level A Activity The Family Size Problem A Conceptual Activity for:Developing an Understanding of the Mean as the “Fair Share” valueDeveloping a Measure of Variation from “Fair Share”

17
A Question How large are families today?Nine children were asked how many people are in your family.Each child represented her/his family size with a collection snap cubes.

18
Snap Cube Representation for Nine Family Sizes

19
How might we examine the data on the family sizes for these nine children?

20
Ordered Snap Cube & Numerical Representations of Nine Family Sizes 2 3 3 4 4 5 6 7 9

21
Notice that the family sizes vary. What if we used all our family members and tried to make all families the same size, in which case there is no variability. How many people would be in each family?

22
How can we go about creating these new families? We might start by separating all the family members into one large group.

23
All 43 Family Members

24
Step 1 Have each child select a snap cube to represent her/him-self. These cubes are indicated in red.

25
Create Nine “New” Families/Step1

26
Step 2 Next have each child select one family member from the remaining group. These new family members are shown in red.

27
Create Nine “New” Families/Step2

28
Continue this process until there are not enough family members for each child to select from.

29
Create Nine “New” Families/Step4

30
Discuss resultsThe fair share value Note that this is developing the division algorithm and eventually, the algorithm for finding the mean.

31
A New Problem What if the fair share value for nine children is 6? What are some different snap cube representations that might produce a fair share value of 6?

32
Snap Cube Representation of Nine Families, Each of Size 6

33
Have Groups of Children Create New Snap Cube Representations For example, following are two different collections of data with a fair share value of 6.

34
Two Examples with Fair Share Value of 6. Which group is “closer” to being “fair?”

35
How might we measure “how close” a group of numeric data is to being fair?

36
Which group is “closer” to being “fair?” The upper group in blue is closer to fair since it requires only one “step” to make it fair. The lower group requires two “steps.”

37
How do we define a “step?” One step occurs when a snap cube is removed from a stack higher than the fair share value and placed on a stack lower than the fair share value.A measure of the degree of fairness in a snap cube distribution is the “number of steps” required to make it fair. Note -- Fewer steps indicates closer to fair

38
Number of Steps to Make Fair: 8 Number of Steps to Make Fair: 9

39
Students completing Level A understand: the notion of “fair share” for a set of numeric datathe fair share value is also called the mean valuethe algorithm for finding the meanthe notion of “number of steps” to make fair as a measure of variability about the meanthe fair share/mean value provides a basis for comparison between two groups of numerical data with different sizes (thus can’t use total)
")
40
Level B Activity The Family Size Problem How large are families today? A Conceptual Activity for:Developing an Understanding of the Mean as the “Balance Point” of a DistributionDeveloping Measures of Variation about the Mean

41
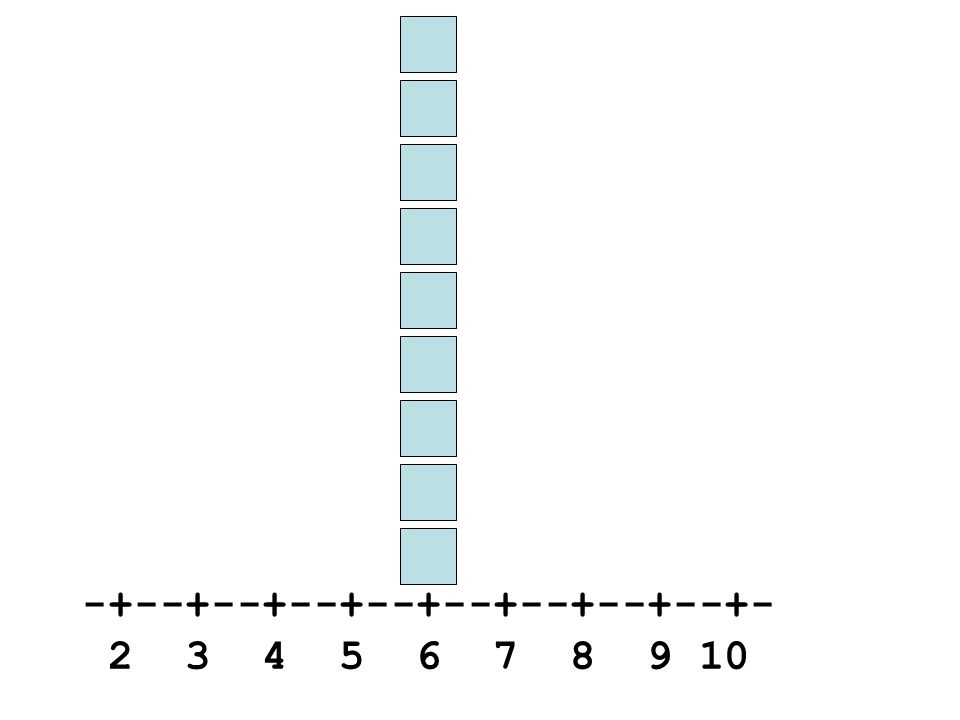
Level B Activity How many people are in your family? Nine children were asked this question. The following dot plot is one possible result for the nine children:

42
-+--+--+--+--+--+--+--+--+- 2 3 4 5 6 7 8 9 10
43
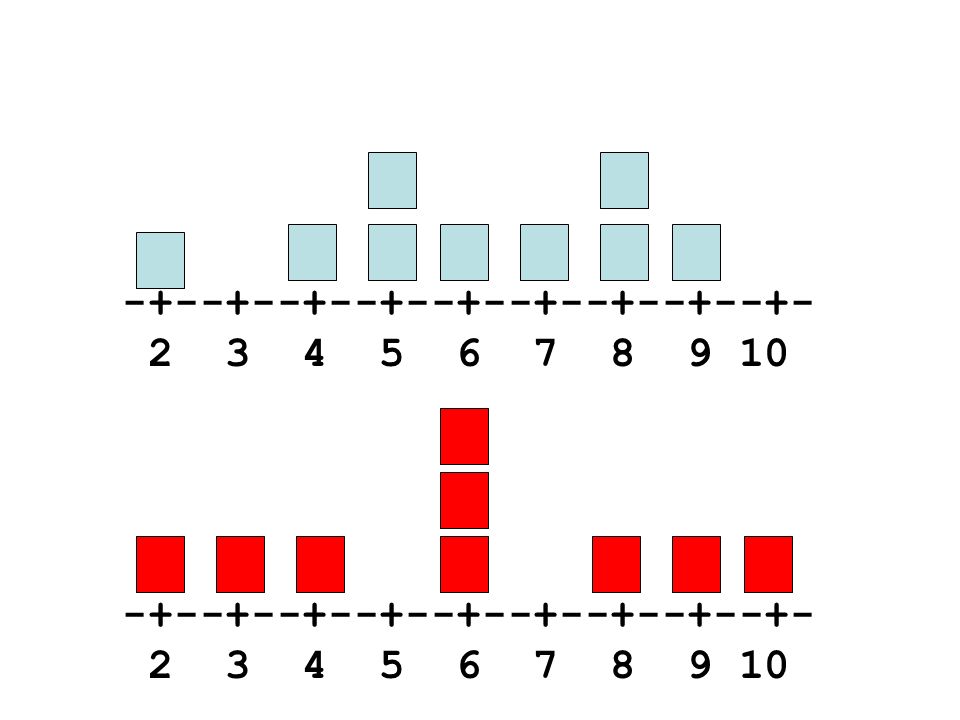
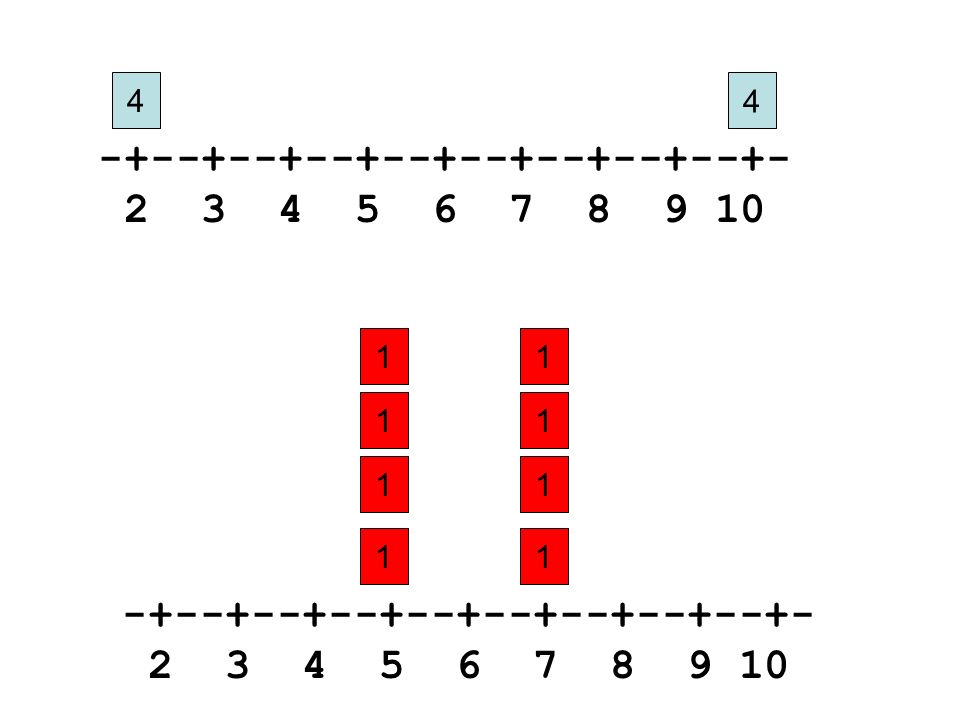
Have groups of students create different dot plot representations of nine families with a mean of 6.

44
-+--+--+--+--+--+--+--+--+- 2 3 4 5 6 7 8 9 10 -+--+--+--+--+--+--+--+--+- 2 3 4 5 6 7 8 9 10
45
In which group do the data (family sizes) vary (differ) more from the mean value of 6?
 vary (differ) more from the mean value of 6")
46
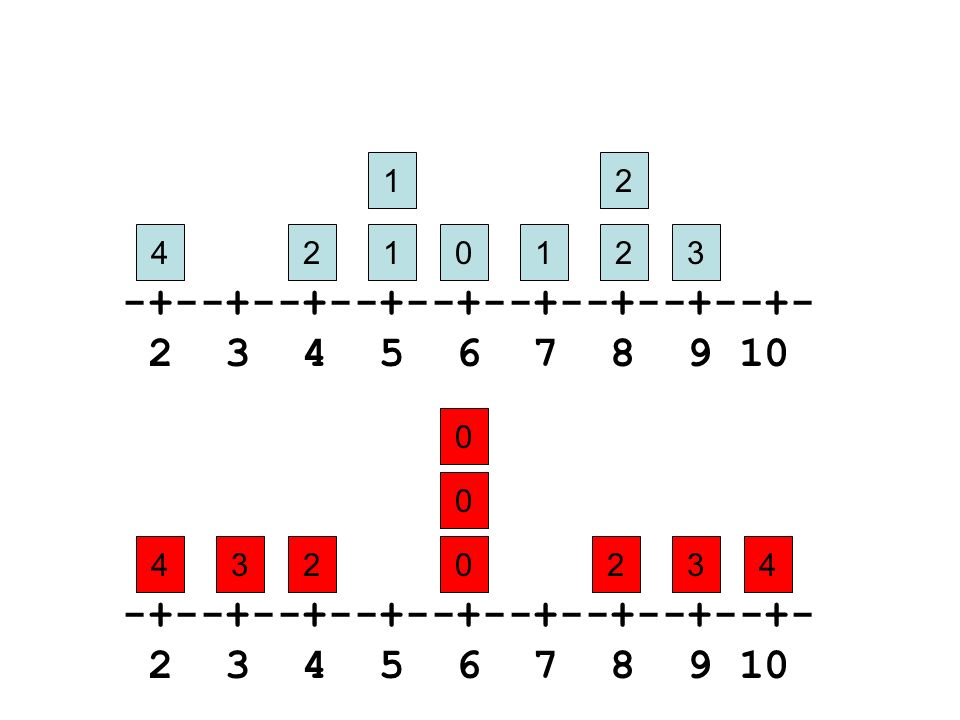
-+--+--+--+--+--+--+--+--+- 2 3 4 5 6 7 8 9 10 -+--+--+--+--+--+--+--+--+- 2 3 4 5 6 7 8 9 10 421 1 012 2 3 4320 0 0 234
47
In Distribution 1, the Total Distance from the Mean is 16. In Distribution 2, the Total Distance from the Mean is 18. Consequently, the data in Distribution 2 differ more from the mean than the data in Distribution 1.

48
-+--+--+--+--+--+--+--+--+- 2 3 4 5 6 7 8 9 10 421 1 012 2 3 Note that the total distance for the values below the mean of 6 is 8, the same as the total distance for the values above the mean. For this reason, the distribution will “balance” at 6 (the mean)
.")
49
The SAD is defined to be: The Sum of the Absolute Deviations Note the relationship between SAD and Number of Steps to Fair from Level A: SAD = 2xNumber of Steps

50
Number of Steps to Make Fair: 8 Number of Steps to Make Fair: 9

51
An Illustration where the SAD doesn’t work!

52
-+--+--+--+--+--+--+--+--+- 2 3 4 5 6 7 8 9 10 -+--+--+--+--+--+--+--+--+- 2 3 4 5 6 7 8 9 10 44 1 1 11 1 1 11
53
The SAD is 8 for each distribution, but in the first distribution the data vary more from the mean. Why doesn’t the SAD work?

54
Adjusting the SAD for group sizes yields the: MAD = Mean Absolute Deviation

55
Measuring Variation about the MeanSAD = Sum of Absolute DeviationsMAD = Mean of Absolute DeviationsVariance = Mean of Squared DeviationsStandard Deviation = Square Root of Variance

56
Summary of Level B and Transitions to Level CMean as the balance point of a distributionMean as a “central” pointVarious measures of variation about the mean.

57
The Mean at Level CAt Level C, the notion of the “Sampling Distribution of the Sample Mean” is Developed.This development connects probability and statistics and provides the link between the descriptive statistics students have learned at Levels A and B and concepts of inferential statistics they will learn at Level C.

58
Eighty Circles/What is the Mean Diameter?

59
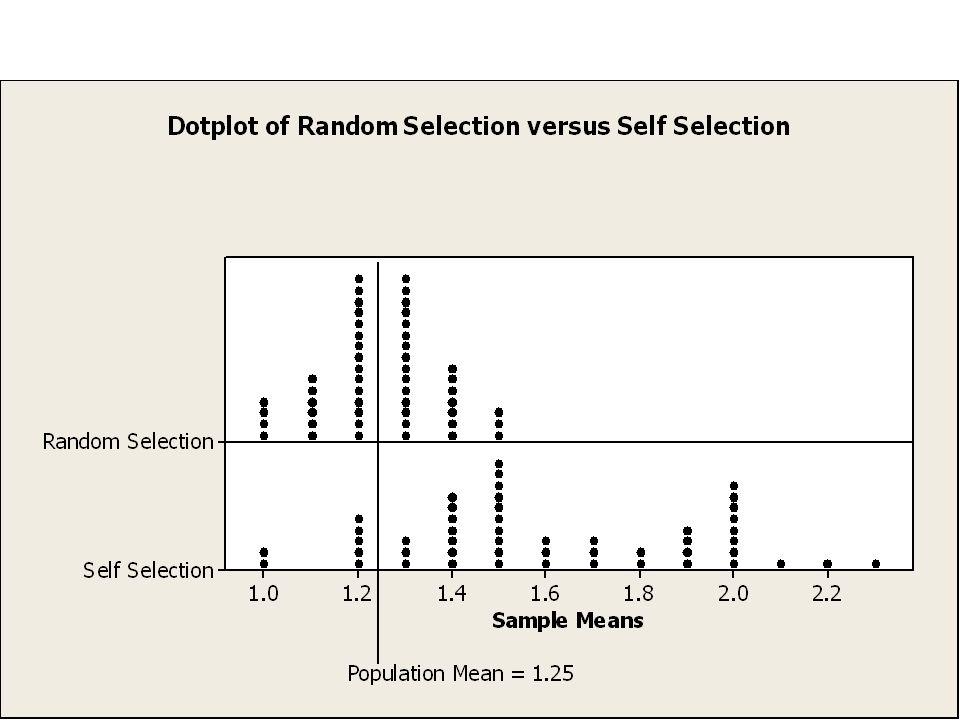
ActivityStudents select samples of 10 circles they considered to be representative of the 80 circles. The mean for each sample is determined.Students select simple random samples of 10 circles. The mean for each sample is determined.

60
How do the results from self-selection compare with random sampling?Following are results from two introductory-level statistics classes (50 students).
.")
62
Sampling Distributions provide the link to two important concepts in statistical inference.Margin of ErrorStatistical Significance

63
The STN article in your packet provides an illustration of how a sampling distribution is used to develop these statistical concepts.

64
SUMMARY: GOALS of GAISE Report Promote and develop statistical literacy Provide links with the NCTM Standards Discuss differences between Mathematics and Statistics Clarify the role of probability in statistics Illustrate concepts associated with the data analysis process Present the statistics curriculum for grades Pre-K-12 as a cohesive and coherent curriculum strand Provide developmental sequences of learning experiences

Similar presentations