Download presentation
Presentation is loading. Please wait.

1
Ather H. Akbari & Imamuddin Khoso

2
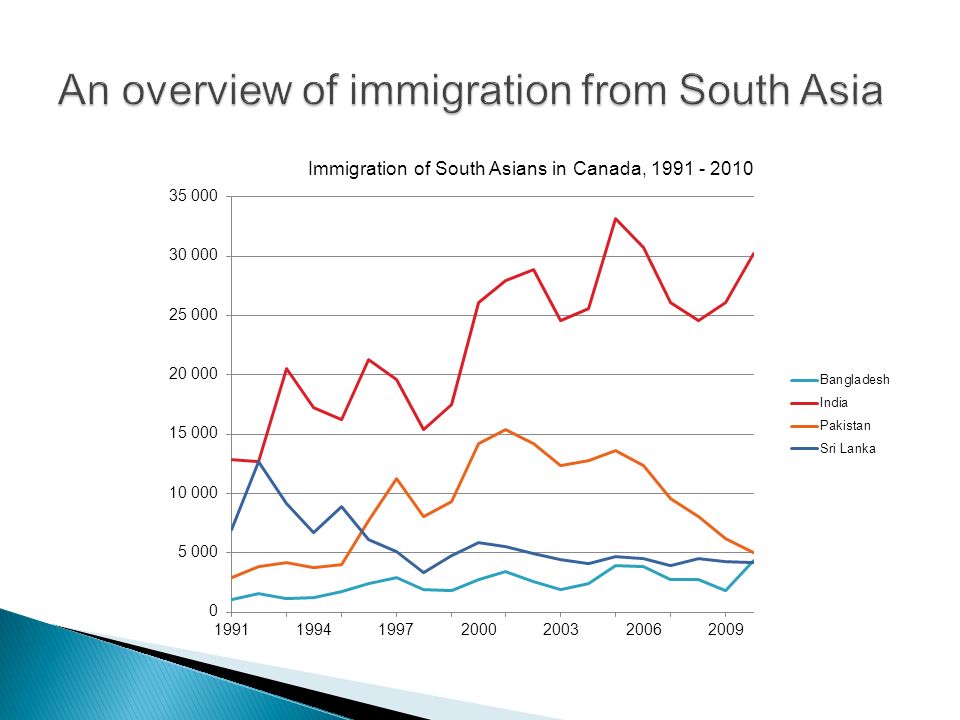
In 2006: ◦ there were 6.2 million immigrants living in Canada out of which 2.5 million had come from Asia and the Middle East – the highest number among all regions. ◦ there were 719,280 immigrants from South Asia, next to those from East Asia who were 874,365. Among South Asian countries, India and Pakistan are the top two source countries of immigrants in Canada.

4
During 2000-2010, India and Pakistan were, respectively, the second and fourth largest source countries of immigrants in Canada. The 2001 census showed that among Indian immigrants, there were 51.5 % Sikhs, 26 % Hindus, 7.2 % Protestants and 7 % Muslims. These religious groups have been living together in India for centuries. Among Pakistani immigrants, there were 84 % Muslims, 9 % Christians, 4 % Hindus and Sikhs and 3 % others.

5
Like other South Asians, immigrants from India and Pakistan share common ethnic customs, traditions, heritage and language. They also share common family values (EDS). In general, the educational systems in the two countries are similar, inherited from their common colonial past. Their geographical distance from Canada is also about the same. Based on the above, one would expect immigrants from the two countries to face similar challenges in the labour market and to have similar labour market qualities and outcomes.
. In general, the educational systems in the two countries are similar, inherited from their common colonial past. Their geographical distance from Canada is also about the same. Based on the above, one would expect immigrants from the two countries to face similar challenges in the labour market and to have similar labour market qualities and outcomes..")
6
To analyze the labour market performances of Indian and Pakistani immigrants in Canada.

7
Labour market indicators: ◦ Earnings ◦ Employment status ◦ Unemployment duration ◦ Employment credential mismatch Housing market indicators: ◦ Home ownership rates

9
Country 20052010 Change (2005-10) Average Annual change INDIA Applications received 53,97354,5831.1 %0.6 % Visas issued37,05533,121-11 %-1.8 % PAKISTAN Applications received 17,76820,87417.5%7.9 % Visas issued14,3336,453-55%-14.6 %
 Average Annual change INDIA Applications received 53,97354, %0.6 % Visas issued37,05533, %-1.8 % PAKISTAN Applications received 17,76820, %7.9 % Visas issued14,3336,453-55%-14.6 %")
10
Table: Top five Source Countries of Immigrants in Canada YEAR 2000 20052010 Source Country Number Source Country Number Source Country Number China, PR 36,749China, PR42,292Philippines36,567 India 26,122India33,142India30,246 Pakistan 14,201Philippines17,525China, PR30,195 Philippines 10,119Pakistan13,575United Kingdom 9,501 Korea, R.O 7,639United States 9,263United States 9,421

12
Immigrants intending to work by skill classification, Canada (%)* CountrySkill level200020052010 INDIAHigh34.743.838.1 Medium15.616.813.2 Low2.61.32.6 PAKISTANHigh56.243.544.8 Medium19.011.07.0 Low4.11.91.1 * Percentage of those intending to work.
* CountrySkill level INDIAHigh Medium Low PAKISTANHigh Medium Low * Percentage of those intending to work.")
13
Labour market indicators of south Asian immigrants in Canada, 2005 Labour market indicator PakistanIndiaOther South Asians Total south AsiansNon-immigrants Year of arrival 2001- 04 Before 2001 2001- 04 Before 2001 2001- 04 Before 2001 2001-04Before 2001 LFPR (%)57.8666.370.8666.4660.568.0465.966.7968.32 U- rate (%)12.458.6910.116.1714.729.4911.347.286.44 Income ($)15,05529,29921,80733,69516,65525, 41519,27031,20935,695 No. of observations 8331,6651,9967,3435942,6023,42311,610527,911 Labour market outcomes

14
CharacteristicsSource country: Pakistan Source country: India Due to differences in characteristics (%) Due to differences in evaluation (%) Due to differences in characteristics (%) Due to differences in evaluation (%) Overall25-6326-38 Age3-2603-9 Weeks-470-21 Gender540.31.5 Education13.5-186.6-12.5 Married5-8.7514.2 Work in large Province31.32.651
 Due to differences in evaluation (%) Due to differences in characteristics (%) Due to differences in evaluation (%) Overall Age Weeks Gender Education Married Work in large Province")
15
Immigrants from South Asia generally have poorer labor market performance than non- immigrants. This is largely because their labor market characteristics are discounted. Performance varies within the South Asian group. It is important to disentangle the effect of ethnicity from the effect of religion on labour market performance.

Similar presentations


>")


