Download presentation
Presentation is loading. Please wait.

1
WELCOME

2
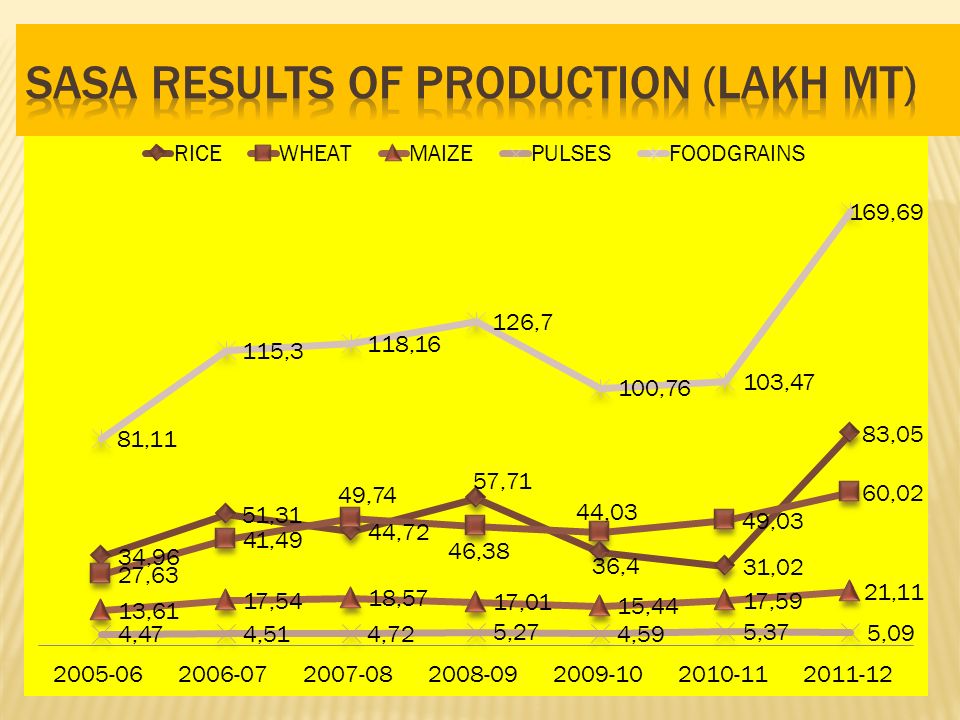
YEARRICEWHEATMAIZEPULSESFOODGRAIN 2005-06 34.9627.6313.614.4781.11 2006-07 51.3141.4917.544.51115.30 2007-08 44.7249.7418.574.72118.16 2008-09 57.7146.3817.015.27126.70 2009-10 36.4044.0315.444.59100.76 2010-11 31.0249.0317.595.37103.47 2011-12 83.0560.0221.115.09169.69 2011-12 (% increase over prev. best) 44%21%14%-34% Source: Department of Statistics,Bihar
 44%21%14%-34% Source: Department of Statistics,Bihar.")
4
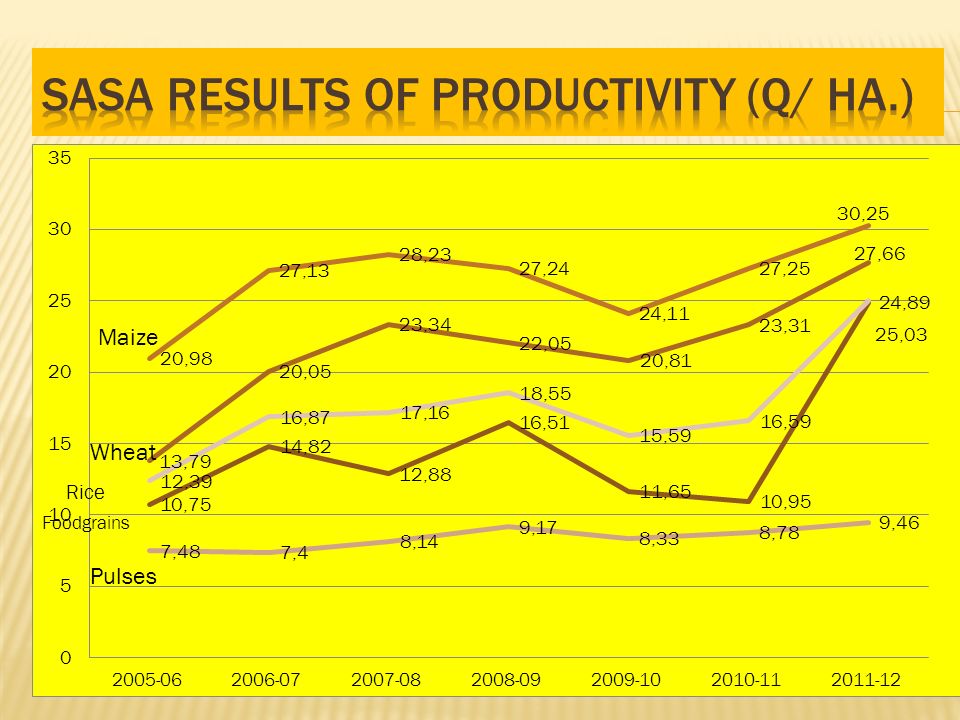
YEARRICEWHEATMAIZEPULSESFOODGRAINS 2005-06 10.7513.7920.987.4812.39 2006-07 14.8220.0527.137.4016.87 2007-08 12.8823.3428.238.1417.16 2008-09 16.5122.0527.249.1718.55 2009-10 11.6520.8124.118.3315.59 2010-11 10.9523.3127.258.7816.59 2011-12 24.8927.6630.259.4625.03 2011-12 (% increase over prev. best) 51%19%25%3%35% Source: Department of Statistics,Bihar
 51%19%25%3%35% Source: Department of Statistics,Bihar.")
6
YearAg. GSDP Growth Rate 2005-0618184 2006-0723265(+)28 2007-0821276(- ) 8 2008-0923744(+) 12 2009-1021298(-) 10 2010-1123484(+)10 2011-201227533(+)17
 (- ) (+) (-) (+) (+)17.")
7
YEARRICEWheatTotal 2007-08 5.550.085.63 2008-09 10.835.0015.83 2009-10 8.904.9713.87 2010-11 8.831.8310.66 2011-12 15.345.5620.90 2011-12 (% increase over prev. best) 421132 Source: FCI website
 Source: FCI website.")
8
Scheme Tar.Exp. (31.3.2012) % Achiev. 60000 Pulses Village 10.18 100 NFSM76.2265.2386 BGREI54.8640.1873 Total141.26115.5982

9
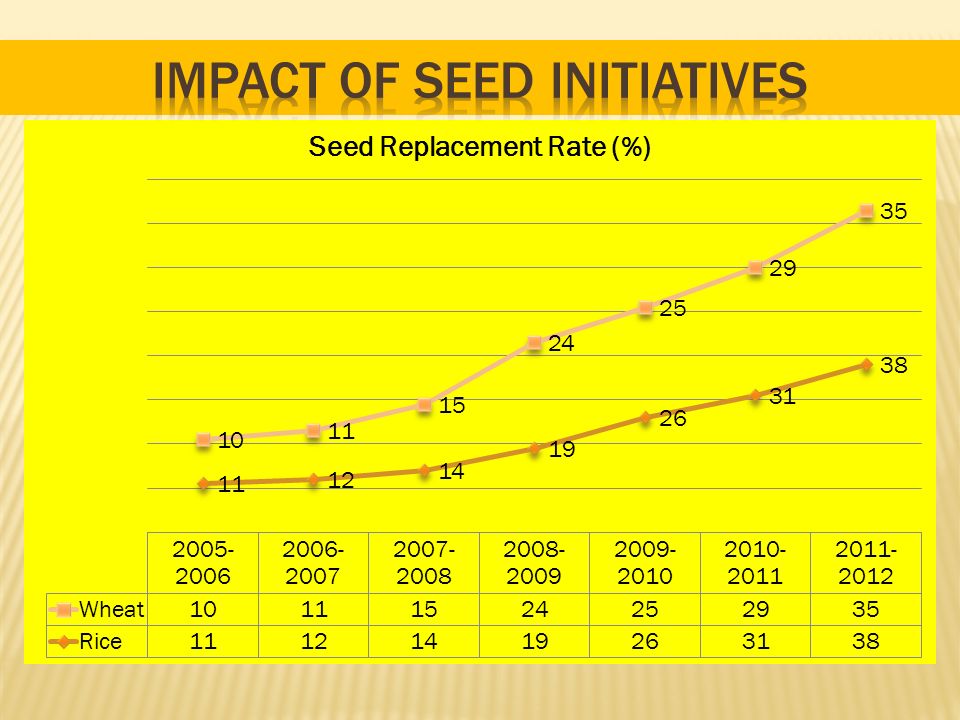
SEEDS Revival Of BRBN AND STATE FARMS CM Crash Seed Programme: Quality Seed to 2 farmers in all villages. Additional Support to farmers (Rs. 7/Kg. for Paddy & Wheat,Rs. 20/Kg for Oilseed,Pulses & Maize) Administration of Seed Subsidy through all registered dealers. Promotion of Hybrid Seed of Paddy. Integrated Seed scheme Breeder seedFoundatio n Seed Certified SeedProcurement/proc essing/storage Use UniversityFarmsSeed VillagesBRBNCrash Programme
 Administration of Seed Subsidy through all registered dealers. Promotion of Hybrid Seed of Paddy. Integrated Seed scheme Breeder seedFoundatio n Seed Certified SeedProcurement/proc essing/storage Use UniversityFarmsSeed VillagesBRBNCrash Programme.")
11
Demand Based Vermi compost programme Subsidy for commercial level Bio fertilizer and Vermi compost units Massive Green Manure Programme Additional Support for Micro nutrients Seed & Soil Treatment with bio pesticide Special programme for pheromone traps and NPV Soil Health Card.

12
YEARVermi compost : Farmer level (No.) Vermi compost: Commercial (No.) Bio fertilize: Commercial level (No.) 2007-08 8414 2008-09 5085 2009-10 1704 2010-11 56344 2011-12 778304806
 Vermi compost: Commercial (No.) Bio fertilize: Commercial level (No.)")
13
Demand Based power tiller, zero tillage and combine harvester Additional support for modern farm implements. Organization of Mela for distribution of farm implements. All leading manufacturers of farm implements across the country participating in kisan mela.

14
YEARPower tillerCombine harvester Zero tillageCono weeder 2007-08 5401091 2008-09 4678551268138 2009-10 4635428601748 2010-11 5330652432021 2011-12 7567109311587725

15
Creation of 4062 posts of SMS(2500 SMS working) 7100 farmers as Kisan Salahkar Increasing Honorarium of SMS from 8500/month to Rs. 15000/month Mobility of extension workers(46 new vehicles purchased and 150 officers upto subdivision level allowed to take vehicles on monthly rental basis) Krishi Darshan, Kisan Call Centre,Krishi Vikas Rath for dissemination of farmer related schemes. Skill development training on massive scale. Use of Farmer Achievers in farmers’ training. Women farmers’ as change agents.
 Krishi Darshan, Kisan Call Centre,Krishi Vikas Rath for dissemination of farmer related schemes. Skill development training on massive scale. Use of Farmer Achievers in farmers’ training. Women farmers’ as change agents..")
16
Wide Publicity of Schemes through Krishi Vikas Rath Block level Kisan Melas for training and inputs. Farmers purchase suggested inputs. Immediate reimbursement. It avoids delays in purchase & distribution of inputs by Govt Officers. Participation of all stakeholders: DOA, ATMA,KVK, Public Representatives, Input dealers and Farmers.

17
InterventionAchievement (Lakh Ha.) SRI3.34 Dhaincha3.70 Hybrid Paddy4.05 SWI1.86 Zero Tillage Wheat0.82
 SRI3.34 Dhaincha3.70 Hybrid Paddy4.05 SWI1.86 Zero Tillage Wheat0.82")
18
Timeliness of planning & Implementation is most critical intervention Fewer & Massive size of interventions are effectively implemented All Stakeholders (Farmer/Scientist/Extension worker/Public Representatives) participation are important Women as change agents is key to success.
 participation are important Women as change agents is key to success.")
19
Agriculture Cabinet for 18 departments. Resource Management Group for Agriculture Road Map under Chief Secretary. Review of performance indicator by Chief Secretary Video Conference with all DM every week Agriculture Task Force under APC at state level and under DM in districts.

20
IssuesDepartment ProcurementSFC/Cooperative Kisan Credit CardsCooperative/Institutional Finance /SLBC Separate Agriculture Feeders (Pilot initiated in Patna district) Energy Land Survey and up dating land records in 3 yearsRevenue 12.14 lakh new TubewellsMinor Irrigation 24 crore Trees in 5 yearsForest & Environment 65 lakh MT Foodgrain storage capacityFood & Civil Supplies/Cooperative 30% processing in 5 yearsIndustries New Agriculture Courses at intermediate levelHigher Education Rural roads connecting all habitations with >250 population Rural Engineering department.
 Energy Land Survey and up dating land records in 3 yearsRevenue lakh new TubewellsMinor Irrigation 24 crore Trees in 5 yearsForest & Environment 65 lakh MT Foodgrain storage capacityFood & Civil Supplies/Cooperative 30% processing in 5 yearsIndustries New Agriculture Courses at intermediate levelHigher Education Rural roads connecting all habitations with >250 population Rural Engineering department.")
21
RiceWheatMaizePulsesFoodgrain 2011-1283.0560.0221.525.09169.69 2016-17*93.6365.7563.4329.20252.01 2021-22*126.0072.0090.6536.00324.65 * Target

22
THANKS

Similar presentations


 IN BIHAR Department of Agriculture Government of Bihar.>")

 GOVERNMENT OF MANIPUR.>")
 Principal Secretary – Agriculture & Co-operation Govt. of Gujarat.>")
