Download presentation
Presentation is loading. Please wait.

1
Sinusoidal Functions Topic 1: Graphs of Sinusoidal Functions

2
Describe the characteristics of a sinusoidal function by analyzing its graph. Interpret the graph of a sinusoidal function that models a situation, and explain the reasoning.

3
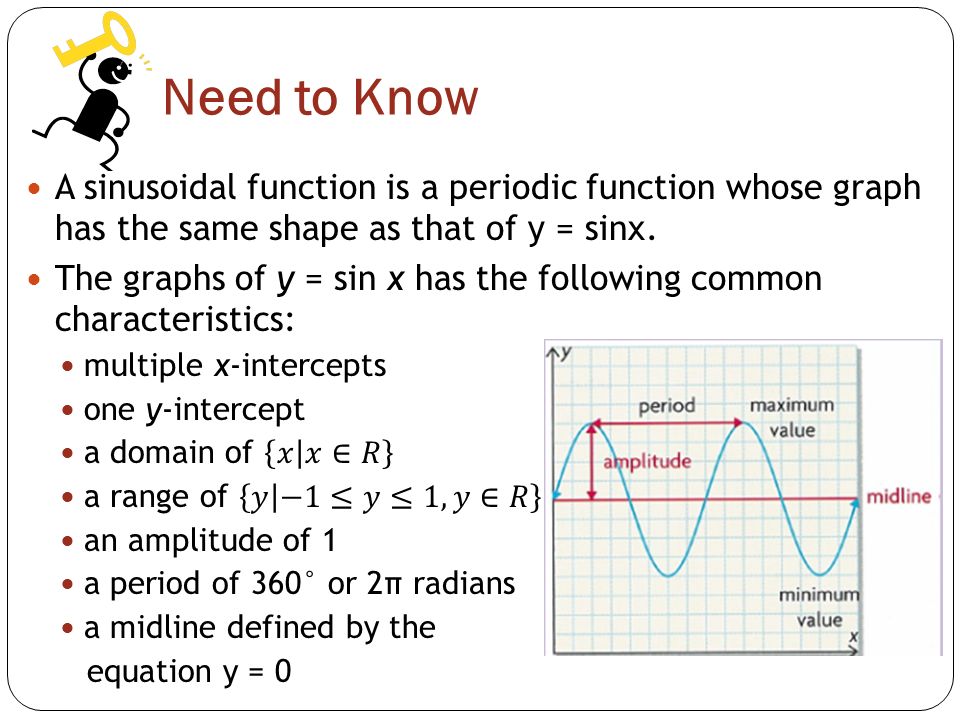
Information A periodic function is a function whose graph looks like “waves” that repeat in regular intervals or cycles. Everyday occurrences such as ocean tides, height of the hands on a clock as a function of time, the height of a rider on a Ferris wheel as a function of time (or anything that repeats in a circular motion at a constant speed), and phases of the moon are all examples that show periodic behavior. The functions y = sinx and y = cosx are examples of periodic functions called sinusoidal functions. A sinusoidal function is a periodic function whose graph has the same shape as that of y = sinx
, and phases of the moon are all examples that show periodic behavior. The functions y = sinx and y = cosx are examples of periodic functions called sinusoidal functions. A sinusoidal function is a periodic function whose graph has the same shape as that of y = sinx.")
4
Information The graphs of sinusoidal functions have many characteristics. The characteristics that may be explored: number of x-intercepts, value of the x- intercept(s), value of the y-intercept, domain, range, equation of the midline, amplitude, and period.
, value of the y-intercept, domain, range, equation of the midline, amplitude, and period..")
5
Information The size of an angle can be measured using degrees. A radian is an alternative way to measure the size of an angle. One radian is approximately 60°. An advantage to using radians to measure angles is that it allows you to express the angle measure using real numbers without units. An angle measure written without units is in radians, not degrees.

6
Example 1 Students in Simon’s graduating class went on an exchange trip to China. While they were there, they rode the Star of Nanchang, one of the tallest Ferris wheels in the world. Simon graphed the periodic function that represented his ride. a) How can you tell that the lowest part of the Ferris Wheel is 2m off the ground. Describe characteristics of a periodic function using a graph The minimum is marked as (30, 2). This means that after 30 minutes, the height is at it’s minimum of 2m off the ground.
 How can you tell that the lowest part of the Ferris Wheel is 2m off the ground. Describe characteristics of a periodic function using a graph The minimum is marked as (30, 2). This means that after 30 minutes, the height is at it’s minimum of 2m off the ground..")
7
Example 1 b) Determine the maximum value of the graph. What is the height of the Ferris wheel? c) Determine the equation of the midline. What does this value represent? One of the maximum values is marked as (15, 160). This means that after 15 minutes, the height is at it’s maximum of 160m off the ground. midline equation Midline = 81
 Determine the equation of the midline. What does this value represent. One of the maximum values is marked as (15, 160). This means that after 15 minutes, the height is at it’s maximum of 160m off the ground. midline equation Midline = 81.")
8
Example 1 d) Determine the amplitude of the graph. What does this value represent? amplitude equation Midline = 81 You can also find amplitude by determining the distance between the maximum and the midline. 160-81 = 79 Amplitude = 79 Amplitude represents the distance between the midline and the maximum or minimum. It represents half the vertical height of the graph.

9
Example 2 For a physics project, Morgan swung on a swing, and Lily used a motion detector to measure Morgan’s height above the ground over time, as she swung back and forth. The girls then switched tasks in order to collect a different data set. Lily swung on a different swing, and Morgan collected the data. The girls graphed their results in two different graphs, as shown. At the end of each cycle, the swing returned to its initial position, which resulted in sinusoidal graphs. Connecting sinusoidal functions to oscillating motion Morgan’s SwingLily’s Swing

10
Example 2 Morgan’s Swing Lily’s Swing a) Compare the characteristics of each graph. 2m 0.75m 2.5m 0.75m 1.5s 2s Midline Amplitude Period Domain Range 1.625 1.375

11
Example 2 Morgan’s Swing Lily’s Swing b) Who swung higher? How do you know? c) Who swung faster? How do you know? Lily swings higher. We know this since she reaches a higher maximum (2.5m). Morgan swings faster. We know this since she completes more cycles at a quicker rate than Lily (Morgan’s graph has a smaller period - 1.5s).
 Who swung faster. How do you know. Lily swings higher. We know this since she reaches a higher maximum (2.5m). Morgan swings faster. We know this since she completes more cycles at a quicker rate than Lily (Morgan’s graph has a smaller period - 1.5s)..")
12
Example 2 Morgan’s Swing Lily’s Swing d) Determine the height above the ground on each swing at 4 s. At 4 seconds, Morgan’s swing is at a height of 1.25 m and Lily’s swing is at a height of about 2.5 m.

13
Example 3 The graph of a sinusoidal function is shown. a) What is the period of the graph? b) Find the maximum and minimum values. c) Using the maximum and minimum values values only, determine the range, the equation of the midline, and the amplitude. Verify your calculations by looking at the graph. Describing the graph of a sinusoidal function in degree measure 180° 7 Maximum 7 and minimum -3. -3 Midline Amplitude Range
 What is the period of the graph. b) Find the maximum and minimum values. c) Using the maximum and minimum values values only, determine the range, the equation of the midline, and the amplitude. Verify your calculations by looking at the graph. Describing the graph of a sinusoidal function in degree measure 180° 7 Maximum 7 and minimum Midline Amplitude Range.")
14
Example 4 The graph of a sinusoidal function is shown. a) What is the period of the graph? b) Find the maximum and minimum values. c) Using the maximum and minimum values values only, determine the range, the equation of the midline, and the amplitude. Verify your calculations by looking at the graph. Describing the graph of a sinusoidal function in radian measure Half a cycle: 2.5 radians 5 radians 2 Maximum 2 and minimum -4. -4 Midline Amplitude Range
 What is the period of the graph. b) Find the maximum and minimum values. c) Using the maximum and minimum values values only, determine the range, the equation of the midline, and the amplitude. Verify your calculations by looking at the graph. Describing the graph of a sinusoidal function in radian measure Half a cycle: 2.5 radians 5 radians 2 Maximum 2 and minimum Midline Amplitude Range.")
15
Information Angles can be measured in degrees or radians.

16
Example 5 Identify characteristics of sinusoidal graphs using radians and degrees 1 360° y=0 0 1 0

17
Example 5 b) Describe the relationships among the range, the midline, and the amplitude of each graph.
 Describe the relationships among the range, the midline, and the amplitude of each graph.")
18
Example 5 c) Adriana says that a sine graph is always a cosine graph translated left by 90°. Do you agree? Explain. If you graph y=cosx with the window settings x:[0, 720, 60] and y:[-1, 1, 1], you get the following graph. If you take this graph and move it left 90°,you get the following. This is not the sine graph. However, if you were to move the cosine graph 90° to the right it would be.

19
Example 6 Sketching the graph of a sinusoidal function in degree measure The midline is Since the graph starts at 2, and one full cycle completes in 120°, we can mark it again there. Graph. Max = 9 Min = -5 The y-intercept is at 2.

20
A periodic function is a function whose graph looks like “waves” that repeat in regular intervals or cycles. The function y = sinx and y = cosx are examples of periodic functions called sinusoidal functions Need to Know

22
The equation of the midline or median is the horizontal line that is halfway between the maximum and minimum values, and it can be found using: The amplitude is the distance from the midline to either the maximum or the minimum, and it’s always expressed as a positive number. It can be found using: The period is the length of the domain that it takes to complete one cycle of pattern of the graph, and it can be found using either

23
Need to Know You’re ready! Try the homework from this section. A radian is an alternative way to measure the size of an angle. One radian is approximately equal to 60. An angle written without units is considered to be radians, not degrees.

Similar presentations