Download presentation
Presentation is loading. Please wait.

1
Measuring the Impact of Robotics and GIS/GPS on Youth STEM Attitudes Gwen Nugent, Bradley Barker, Michael Toland, Neal Grandgenett, Slava Adumchuk

2
4 Conducted in after-school settings and 4-H clubs Developed for middle school students Involves week-long intensive summer camp –Youth build and program robots (LEGO NXT Mindstorms), work with hand-held GPS devices, and develop GIS maps
, work with hand-held GPS devices, and develop GIS maps")
3
Research Purpose: To investigate the impact of the program in promoting STEM learning and impacting STEM attitudes

4
STEM Learning Four studies showed significant increases in student learning of: –Computer programming –Mathematics –Geospatial concepts –Engineering/robotics

5
STEM Attitudes Studies of STEM attitudes showed no increases: –Use of existing instruments revealed alignment problems –High pre-test scores Led to development of new instrument

6
Underlying Constructs: Motivation Task Value Math - It is important for me to learn how to use mathematical formulas to help solve practical problems. Science - I like using the scientific method to solve problems. GPS/GIS - I like learning new technologies like GPS. Robotics - It is important for me to learn about robotics.

7
Underlying Constructs: Motivation Self-efficacy I am certain I can build a LEGO robot by following design instructions. I am confident that I can make a digital map.

8
Underlying Constructs: Learning Strategies Teamwork I like to work with others to complete projects. Problem solving I make a plan before I start to solve a problem.

9
Confirmatory Factor Analysis Sample –514 Nebraska students aged 11 – 15 years –Equal percentage of male and female –Primarily Caucasian (95%) –Drawn primarily from rural schools
 –Drawn primarily from rural schools")
10
Confirmatory Factor Analysis CFA model examined item loadings and fit statistics –Fit indices: Chi-square test, standardized root mean squared residual, root mean square of estimation, comparative fit index

11
CFA Results MeasureChi-square (df)SRMRRMSEACFIα Motivation: Task Value 161.2 (59), p <.001.048**.061*.942* Science/ Math.64 GPS/GIS.78 Robotics.80 Self-efficacy.77 Learning85.93 (41), p <.001.053**.048**.951** Problem Approach.64 Teamwork.72 **Meets acceptable fit criteria * Close to acceptable fit criteria
SRMRRMSEACFIα Motivation: Task Value (59), p < **.061*.942* Science/ Math.64 GPS/GIS.78 Robotics.80 Self-efficacy.77 Learning85.93 (41), p < **.048**.951** Problem Approach.64 Teamwork.72 **Meets acceptable fit criteria * Close to acceptable fit criteria")
12
Revisions to Instrument Concern that some scales within motivation construct were under identified –Low α on science/math task value led to splitting into two separate scales –Task value items revised to use parallel language to probe “importance” and “liking” –Self-efficacy scale was split into two scales for robotics and GPS/GIS Final instrument contains 33 items, 8 scales, with 4 to 5 items per scale

13
Results from Use of New Instrument Summer 2008 camps –147 youth in six camps –112 males and 35 females –75% Caucasian –Mean age 12.28 years Dependent t-tests run for pre to post total and scale scores

14
Results: Motivation MeasureM (pre)M (post)t(df)p-value (one tail) α Motivation Task Value Science4.044.204.15 (133)p <.001.75 Math4.034.142.06 (133)p <.05.83 Robotics4.344.411.65 (133)p =.05.83 GPS/GIS4.11.02 (133)p =.49.86 Self-efficacy Robotics4.104.547.31(129)p <.001.64 GPS/GIS4.014.395.84 (129)p <.001.72
M (post)t(df)p-value (one tail) α Motivation Task Value Science (133)p < Math (133)p < Robotics (133)p = GPS/GIS (133)p = Self-efficacy Robotics (129)p < GPS/GIS (129)p <")
15
Results: Motivation Youth increased their perceived value of math, science, and robotics. Perceived value of GPS/GIS did not increase, but their confidence in using GPS/GIS did. Confidence in robotics skills increased.

16
Results: Learning Strategies MeasureM (pre)M (post)t(df)p-value (one tail) α Learning Strategies Problem Approach 3.833.962.41(133)p<.01.80 Teamwork4.084.07.13 (129)p=.448.88 Total Attitude147.52155.915.09(133)p<.001.95
M (post)t(df)p-value (one tail) α Learning Strategies Problem Approach (133)p< Teamwork (129)p= Total Attitude (133)p<")
17
Results: Learning Strategies Students increased in their problem solving skills Teamwork skills did not increase, leading to follow-up gender analyses Follow-up analysis used split plot design with time (pre-post) as within subject variable and gender as between subject variable
 as within subject variable and gender as between subject variable")
18
Results by Gender Robotics Task Value (significant interaction)
")
19
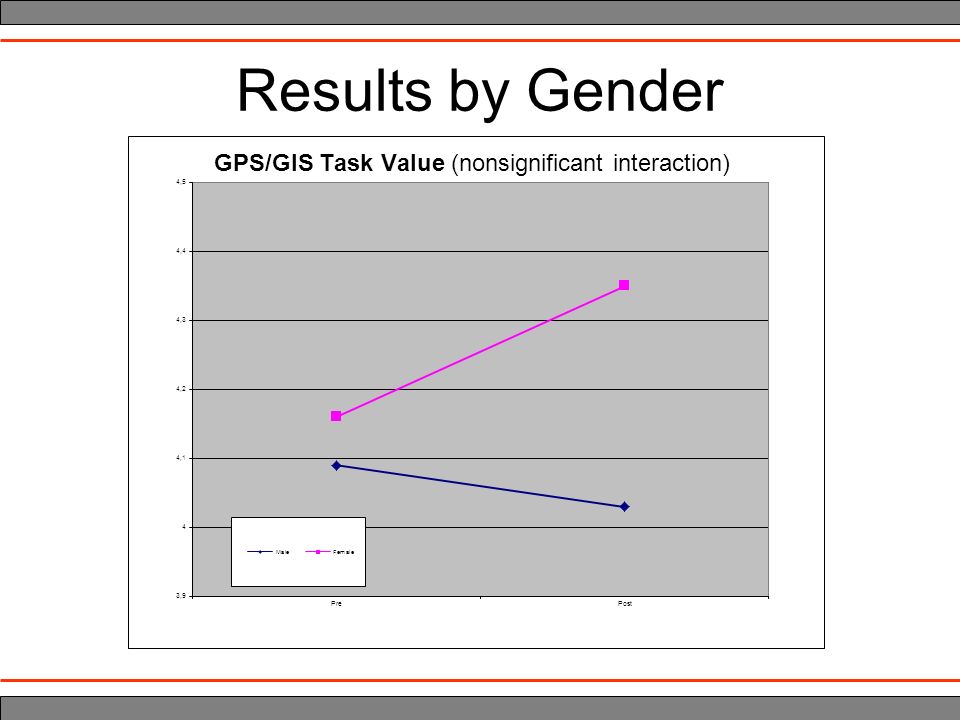
Results by Gender

21
Summary and Discussion Attitudinal improvements in several key areas have been documented. Comparisons with a control group also show significantly higher attitude scores for robotics group. New research has shown that even short- term robotics interventions can influence youth attitudes.

22
Summary and Discussion Alignment of attitude instrument with nature of instructional program is critical. –Instead of science is good for everybody, use it is important for me to learn how to collect and interpret data. –Self-efficacy items focus on program-related tasks.

23
Summary and Discussion Our instrument may provide a template for other researchers interested in measuring STEM attitudes

Similar presentations


: A Cross-Cultural Validation Anita Welch, Claudette Peterson, Chris Ray,>")


