Download presentation
Presentation is loading. Please wait.

1
FM Lavender, RT Meades, A Al-Nahhas, KS Nijran Imperial College Healthcare NHS Trust, London, UK

2
Quantitation software: uses thresholding, binarization, and clusterification to estimate position of myocardial surfaces. Left ventricular ejection fraction : LVEF = (EDV-ESV )x100% EDV The LVEF provides quantitative functional information about the heart. Comparison of the LVEF at rest/stress gives a measure of the level of reversible ischaemia. Comparison of the LVEF between successive scans gives an indication of the level of deterioration or response to treatment.
x100% EDV The LVEF provides quantitative functional information about the heart. Comparison of the LVEF at rest/stress gives a measure of the level of reversible ischaemia. Comparison of the LVEF between successive scans gives an indication of the level of deterioration or response to treatment..")
3
The aims of this study were to compare the effects of: 1. Quantitation software : 101 patients Quantitative Gated SPECT vs 4DMSPECT 2. Pre-reconstruction filtering : 32 patients Butterworth filter of varying order and cut-off frequency on LVEF quantification.

4
101 patients Acquisition method: Siemens ECAM dual-head gamma camera SPECT acquisition: 32 projections, 30second/projection. 400-750MBq Tc99m Tetrofosmin 64x64 matrix, 6.59mm pixel size ECG gated into 8 time bins

5
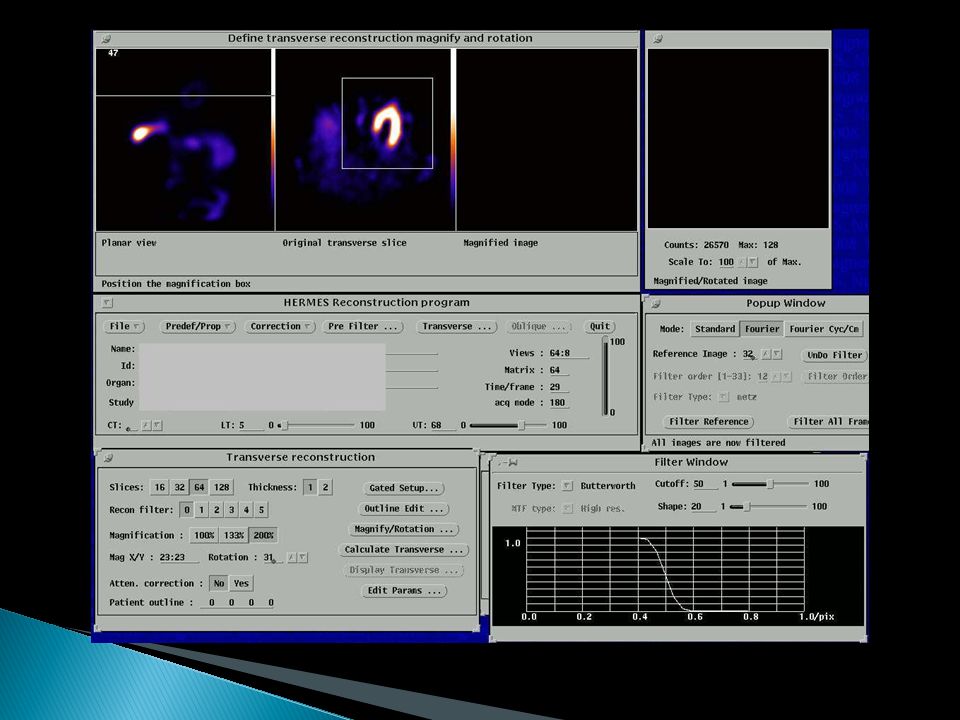
Gated SPECT AutoCardiac 4DMSPECT University of Michigan QGS Cedars-Sinai Medical Centre ReconstructionQuantitationAcquisition Hermes workstation esoft workstation

8
Range +21% to -28%

9
ESV≤30ml [1], 53 patientsESV>30ml, 48 patients [1] Hambye et al. Eur J Nucl Med Mol Imaging. 2004; 31(12):1606-13
![ESV≤30ml [1], 53 patientsESV>30ml, 48 patients [1] Hambye et al.](http://images.slideplayer.com/24/7396279/slides/slide_9.jpg "Eur J Nucl Med Mol Imaging. 2004; 31(12):")
10
Small hearts: EF>50% for ALL patients Partial volume effect ESV estimation of 5ml is unlikely to be accurate. Khalil et al. reported that LVEF of small hearts was overestimated by 12% compared to gated blood pool [2]. [2] Khalil et al., Nucl Med Commun. 2006 Apr; 27(4):321-32.
:")
11
ESV≤30ml Mean difference ±SD -0.2 ± 6.4% ESV>30ml Mean difference ±SD 4.7 ± 6.2%

12
Manual correction necessary in 5% QGS and 4% 4DMSPECT

13
High uptake of tracer in the gut QGS 5/101 High uptake of tracer in the gut Inaccurate valve plane positioning [3] 4DMSPECT 4/101 Surface that intersects most basal myocardial points Surface perpendicular to the long axis of heart [3] Nakajima et al. J Nucl Med. 2001 Oct;42(10):1571-8
![High uptake of tracer in the gut QGS 5/101 High uptake of tracer in the gut Inaccurate valve plane positioning [3] 4DMSPECT 4/101 Surface that intersects most basal myocardial points Surface perpendicular to the long axis of heart [3] Nakajima et al.](http://images.slideplayer.com/24/7396279/slides/slide_13.jpg "J Nucl Med Oct;42(10):")
14
Manual contour correction to exclude activity in the gut

15
The effect of perfusion defects on LVEF is controversial. Vanhove 2002: gated blood pool imaging Concluded that the accuracy of QGS was dependent on the severity but not the extent of perfusion defects [4]. Valejo 2000: MRI Perfusion defects led to an increase in overestimation of EF by QGS [5]. [4] Vanhove et al. Eur J Nucl Med Mol Imag 2002 Jun;29(6):735-41 [5] Valejo et al. J Nucl Med. 2000 May;41(5):874-82
: [5] Valejo et al. J Nucl Med May;41(5):")
16
(a)(b)(c)(d) Short axis and vertical long axis slices from a patient exhibiting high tracer uptake in the gut. Order 5 Butterworth filter at cut-off frequencies of (a, b) 0.5cycles/cm, (c) 0.6cycles/cm, (d) 0.7cycles/cm. 0.5cycles/cm0.6cyc/cm0.7cyc/cm
 0.5cycles/cm, (c) 0.6cycles/cm, (d) 0.7cycles/cm. 0.5cycles/cm0.6cyc/cm0.7cyc/cm.")
17
Van Laere comments that, “Recommended choices for a SPECT filter in the scarce literature on this subject are almost as numerous as the number of authors.” [6] As the cut-off frequency is increased, larger volumes and smaller LVEFs were estimated using QGS [7]. The volumes and LVEF reported to plateau above 0.50cyc/cm [8]. [6] Van Laere et al. Comput Med Imaging Graph. 2001 Mar-Apr;25(2):127-33. Review. [7] Kakhki et al. Clin Nucl Med. 2007 May;32(5):404-6. [8] Nakajima et al. Eur J Nucl Med. 2000 Sep;27(9):1372-9.
![ Van Laere comments that, Recommended choices for a SPECT filter in the scarce literature on this subject are almost as numerous as the number of authors. [6] As the cut-off frequency is increased, larger volumes and smaller LVEFs were estimated using QGS [7].](http://images.slideplayer.com/24/7396279/slides/slide_17.jpg " The volumes and LVEF reported to plateau above 0.50cyc/cm [8]. [6] Van Laere et al. Comput Med Imaging Graph Mar-Apr;25(2): Review. [7] Kakhki et al. Clin Nucl Med May;32(5): [8] Nakajima et al. Eur J Nucl Med Sep;27(9):")
18
32 patients Reconstruction performed using Hermes FBP SPET Pre-reconstruction filter: Butterworth Orders 5 and 10 Cut-off frequencies 0.5 to 1.2 cycles/cm in steps of 0.1cycles/cm. 512 reconstructions

19
No obvious plateau Effect of cut-off frequency on EF is very patient specific

20
At cut-off frequency of 0.5cyc/cm, maximum difference index was 42%. At cut-off frequencies ≤ 0.8cyc/cm, the EF was overestimated compared to higher cut-off frequencies in 26/30 patients. Difference index= For z=0.5 to 1.2cyc/cm

21
Why do we get large variations? Reconstruction process is not fully automated. Image is filtered, then axes have to be re- aligned for each reconstruction.

33
Method: Repeated filtering for first ten patients (320 reconstructions) Results: Average difference between initial and repeated results was <0.1% for both orders Therefore manual axes alignment does not significantly affect LVEF estimation.
 Results: Average difference between initial and repeated results was <0.1% for both orders Therefore manual axes alignment does not significantly affect LVEF estimation.")
34
4DMSPECT and QGS estimate significantly different EFs (range 21% to -28%) and should not be used interchangeably. The agreement between the packages is worse for small hearts (ESV≤30ml) and may also be affected by severe perfusion defects and manual contour correction. LVEF is dependent on the cut-off frequency used during pre-reconstruction filtering but the dependency is very patient specific. Changing the cut-off frequency by as little as 0.1cyc/cm sometimes resulted in changes to the EF of >10 absolute EF percentage points.
 and may also be affected by severe perfusion defects and manual contour correction. LVEF is dependent on the cut-off frequency used during pre-reconstruction filtering but the dependency is very patient specific. Changing the cut-off frequency by as little as 0.1cyc/cm sometimes resulted in changes to the EF of >10 absolute EF percentage points..")
Similar presentations


 Inclusion criteria.>")


