Download presentation
Presentation is loading. Please wait.

1
Quantifying Transportation Needs and Assessing Revenue Options: The Texas Experience presented to The Arkansas Blue Ribbon Committee on Highway Finance Dr. David Ellis Research Scientist Texas Transportation Institute The Texas A&M University System College Station, Texas Phone: 979.845.6165 E-mail: d-ellis@tamu.edu

2
Two Efforts The 2030 Committee to Determine Transportation Needs and Recommend Investment Level The TRENDS Model to Assess Revenue Alternatives

3
Desired Mobility Level Analytical Process Investment Required Current/Future Revenue Stream Current/Future Expense Stream Economic ImpactBenefit/Cost The TRENDS Model The 2030 Committee

4
The 2030 Committee Needs Assessment

5
Needs Determination Process Summary Travel demand models Peak period speeds Regular delay and incident/irregular delay Calculate performance measures Identify road sections over congestion threshold Estimate road needed to accomplish scenario Group by area type and functional class Estimate cost for area/functional class additions Add interchange and right-of-way costs

6
Urban Mobility Analysis Overview Performance Measures Peak and free-flow travel speed Delay reductions from signal coordination, access mgmt, incident clearance, ramp metering Texas Congestion Index Delay per “commuter” Total delay and extra fuel costs

7
Types of Benefits Delay savings – compared to free-flow Fuel savings – simple estimate (% of delay) Reduced cost of goods and services (productivity) Business Effects ◦ Economic impact of construction ◦ Business profitability & job creation Local tax revenue
 Reduced cost of goods and services (productivity) Business Effects ◦ Economic impact of construction ◦ Business profitability & job creation Local tax revenue")
8
Cost (billions of $ 2008) Maintain Economic Competitiveness Reduce Congestion Current Funding Trend Prevent Worsening Congestion Inadequate Mobility Investment MINIMUM Delay Hours per Commuter in 2030 Mobility Investment and Congestion Mitigation
 Maintain Economic Competitiveness Reduce Congestion Current Funding Trend Prevent Worsening Congestion Inadequate Mobility Investment MINIMUM Delay Hours per Commuter in 2030 Mobility Investment and Congestion Mitigation")
9
Costs of Improvements and Congestion Costs in Billions (2008 $)
")
10
Total Investment Needed: 2010 to 2030 (in 2008 $) 2030 Need AreaInvestment Required Pavements $ 89 Billion Bridges $ 36 Billion Urban Mobility $ 171 Billion Rural Mobility and Safety Projects $ 17 Billion TOTAL $ 313 Billion
 2030 Need AreaInvestment Required Pavements $ 89 Billion Bridges $ 36 Billion Urban Mobility $ 171 Billion Rural Mobility and Safety Projects $ 17 Billion TOTAL $ 313 Billion")
11
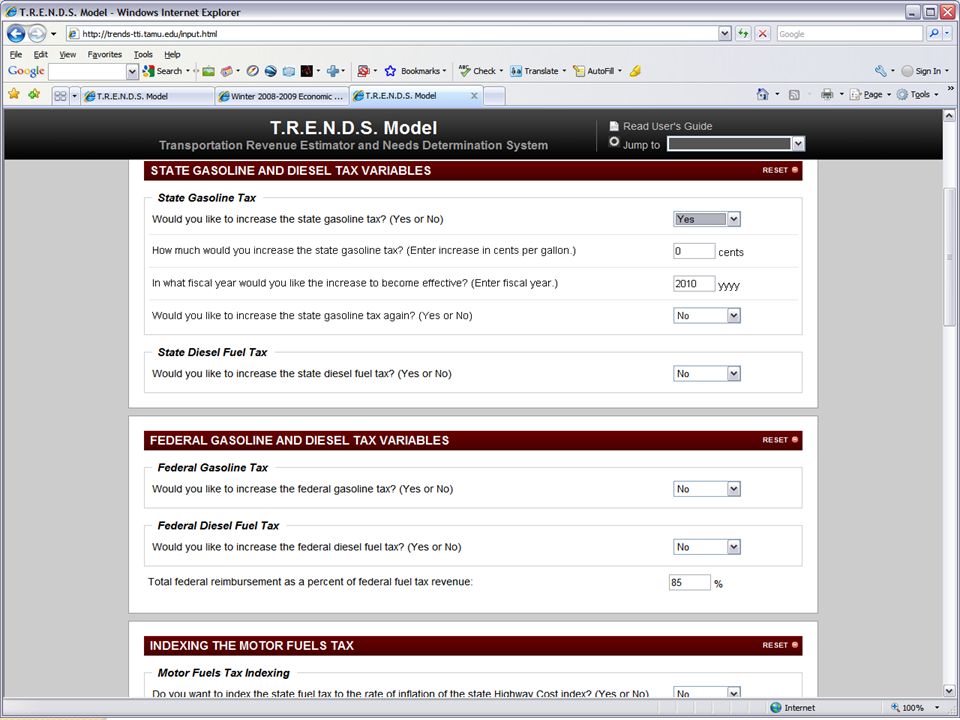
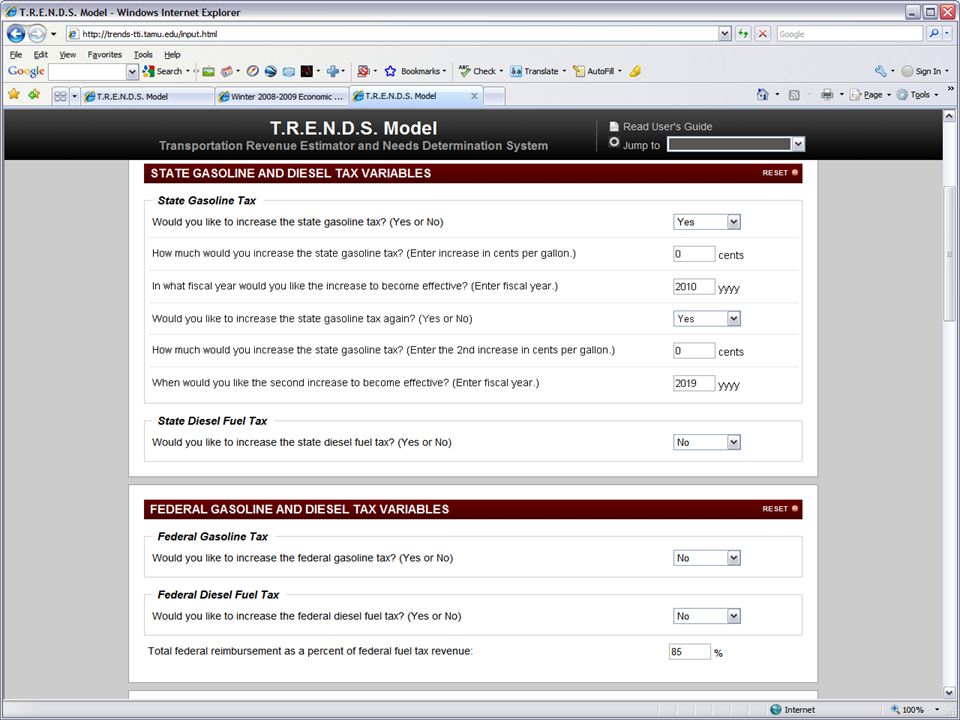
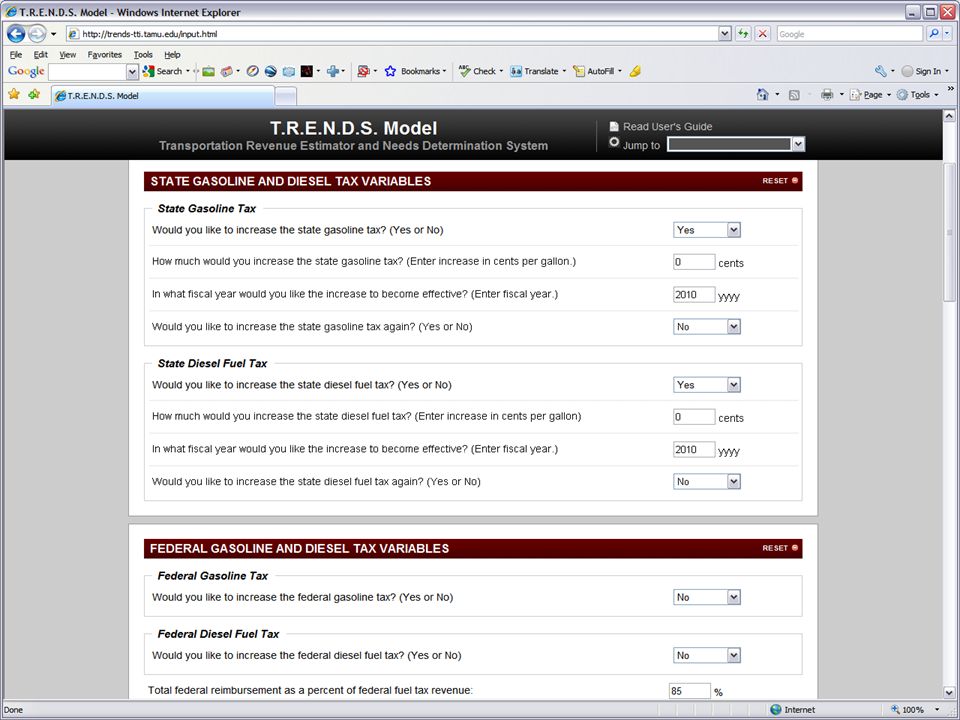
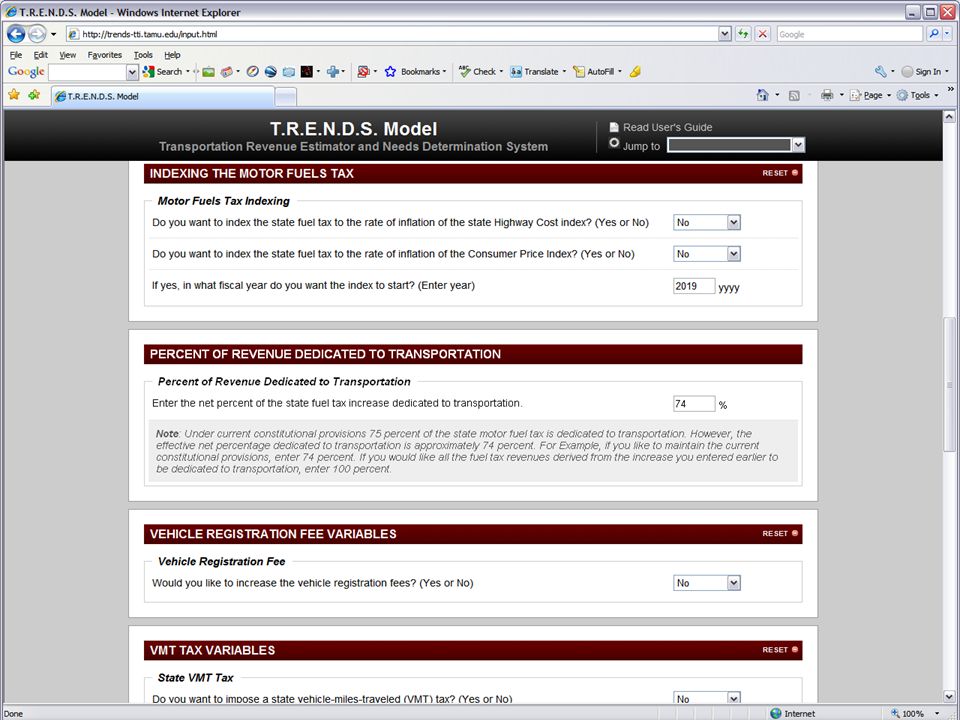
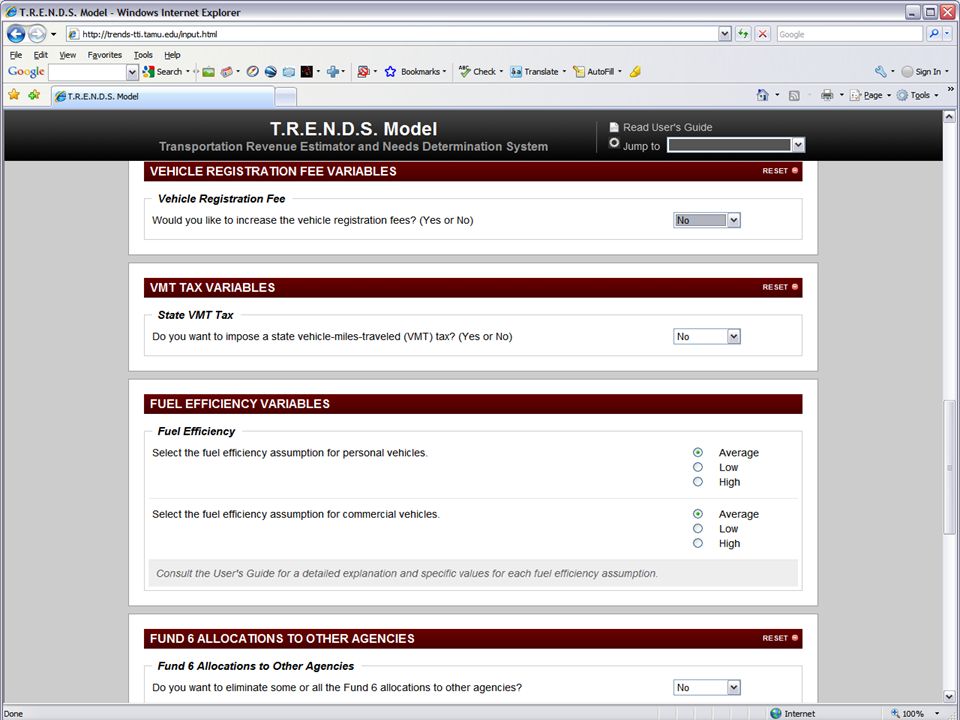
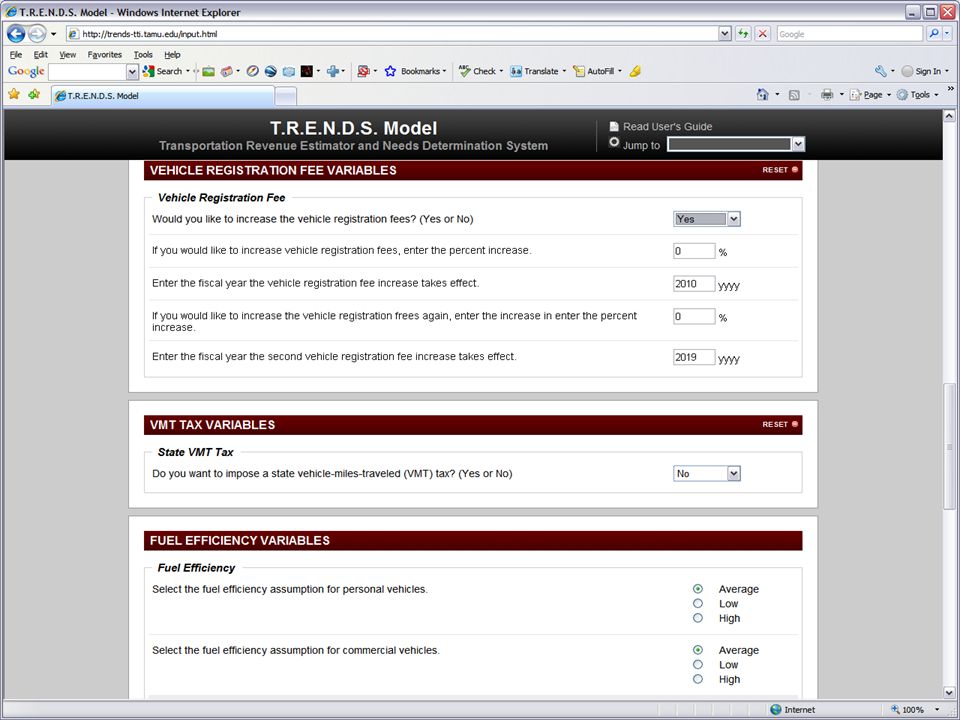
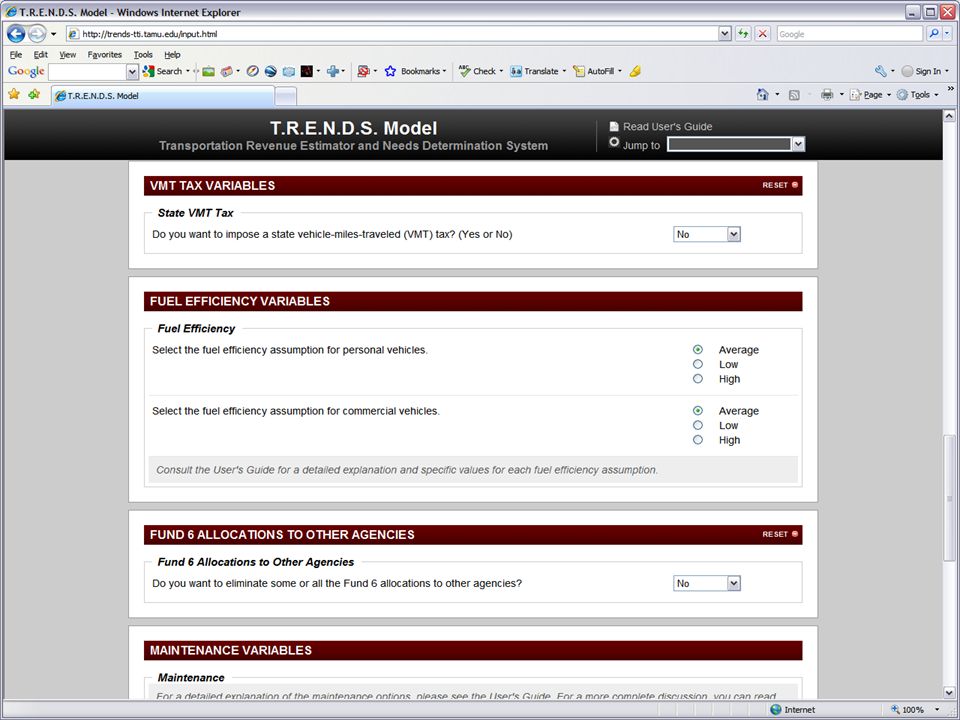
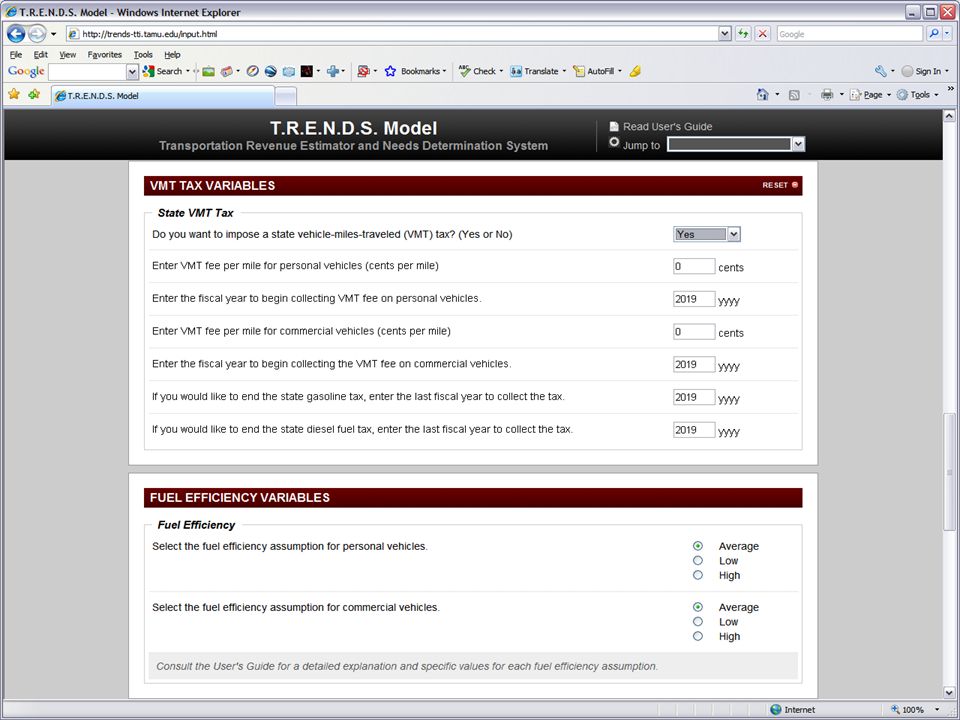
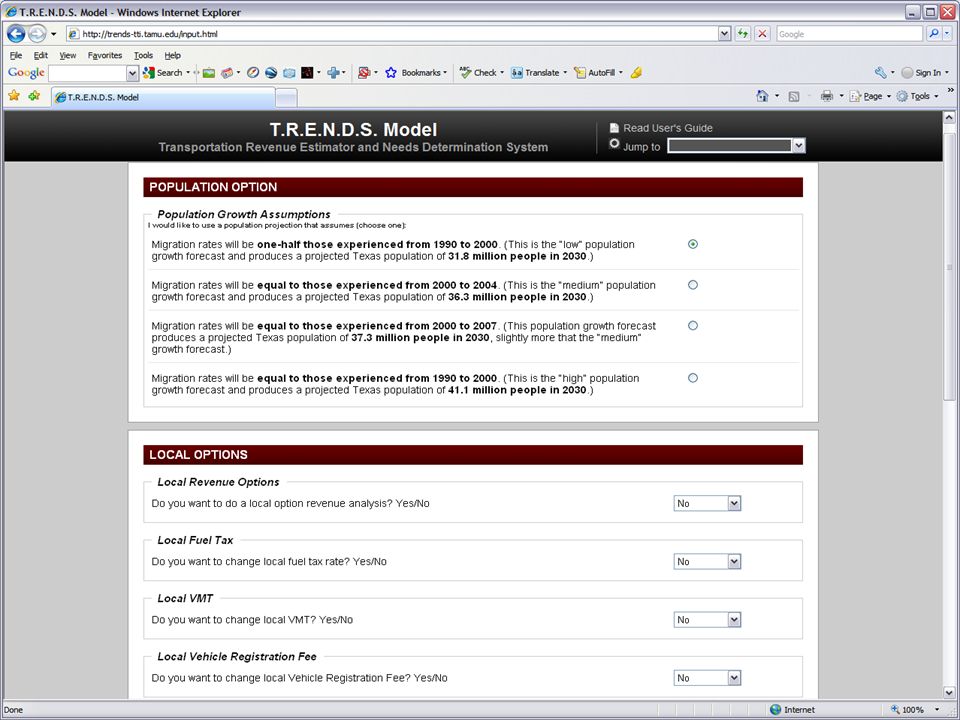
The Transportation Revenue Estimator and Needs Determination System (TRENDS) Model
 Model")
12
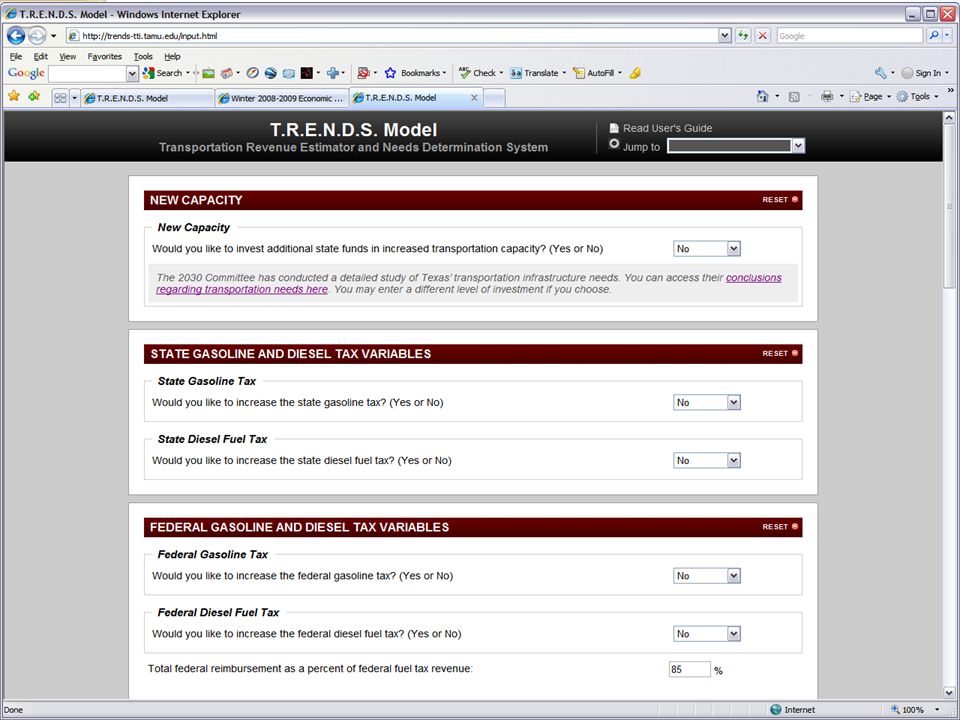
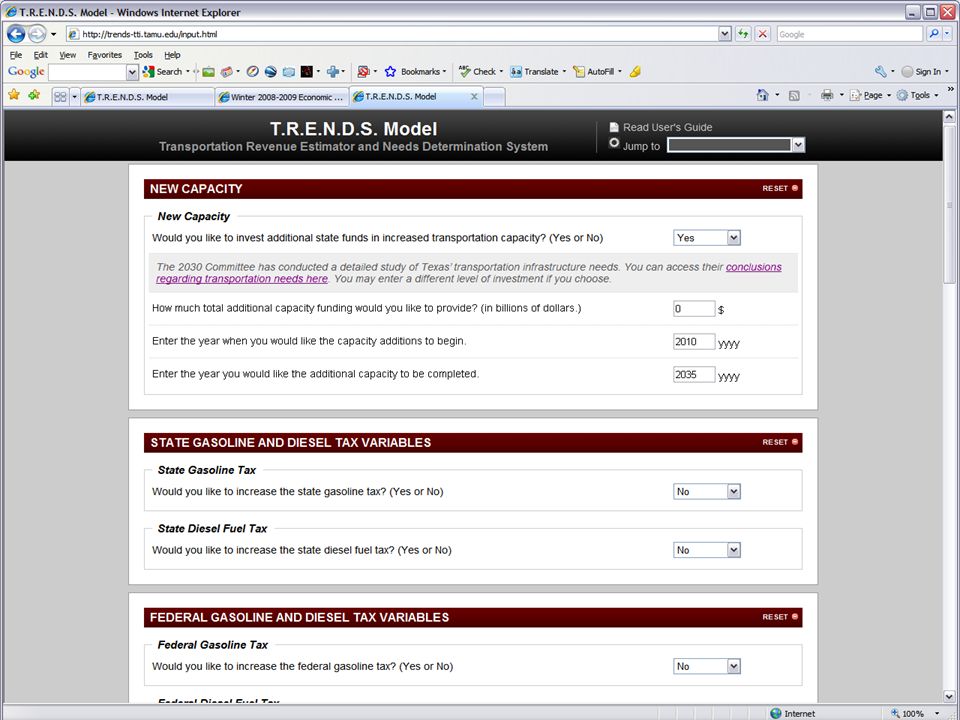
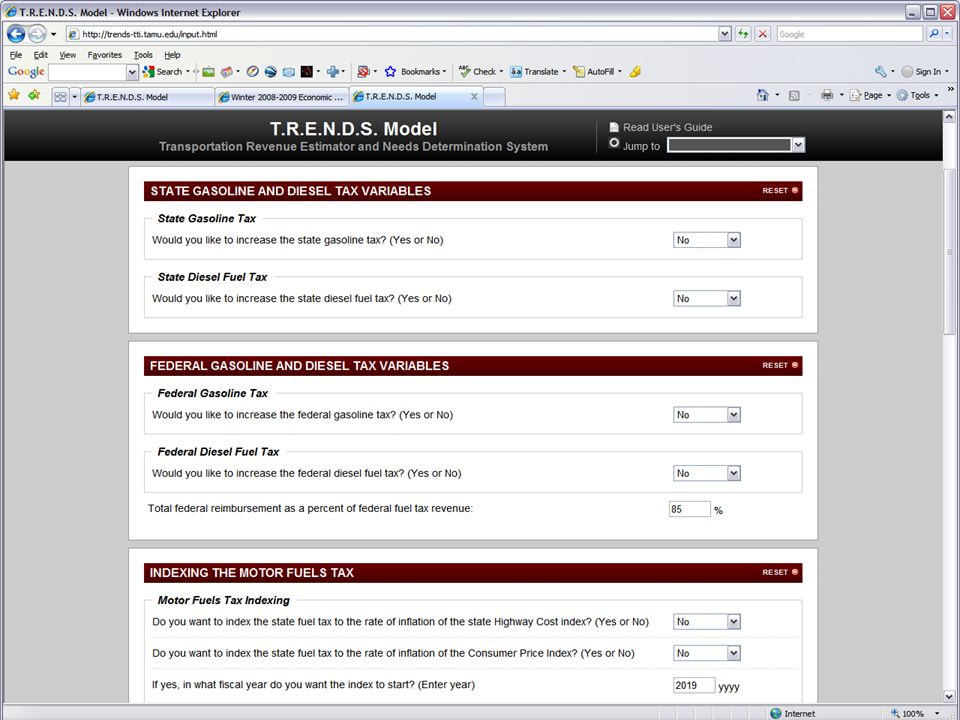
Dynamic and Interactive Analytical Planning Tool Web-based Menu Driven Allows User to Make Choices

13
TRENDS Model Process Gallons of Fuel Used Population Relationship of Fuel Used to Population Fuel Efficiency Fuel Used/Fuel Efficiency = VMT Future Population yields Future Fuel Use and VMT

14
The Relationship Between Gasoline Used and Population

15
Relationship Between Diesel Fuel and Population

16
68 Variables Taxes Fees Maintenance Levels Fuel Economy Inflation Rate Population

17
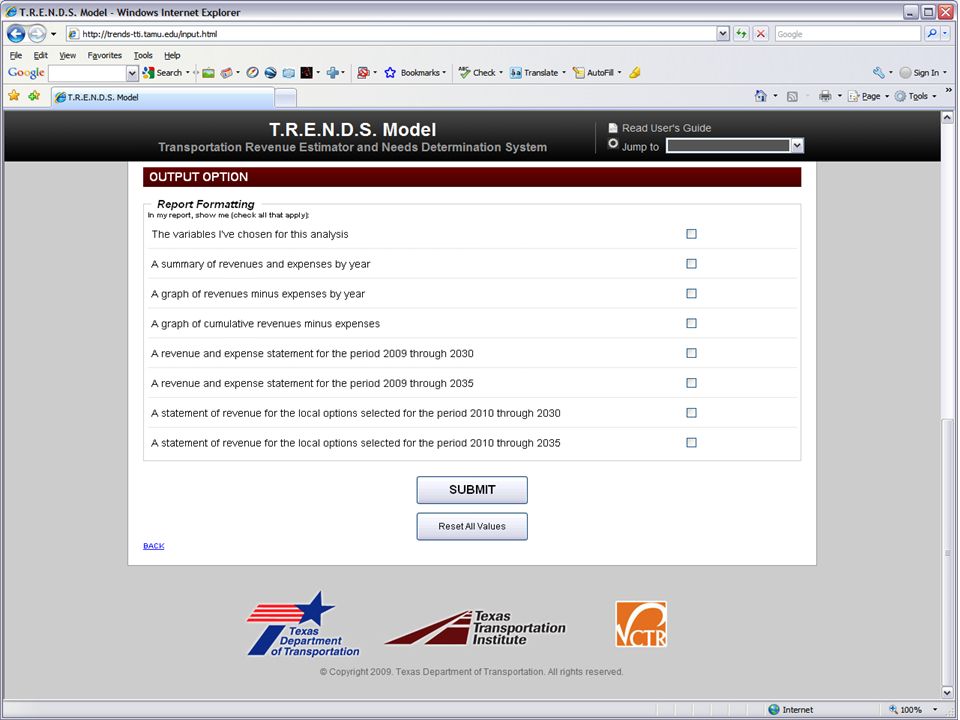
Report Formats Tabular Form Revenue and Expense Statement Charts

18
Backcasting Using the TRENDS Model Absolute Mean Value of Error: 1992-2008 Gasoline Revenues:2.19 % Diesel Revenues:2.68 % Registration Fee Revenues:2.55 %

31
Alternative Fuel Economy Scenarios

35
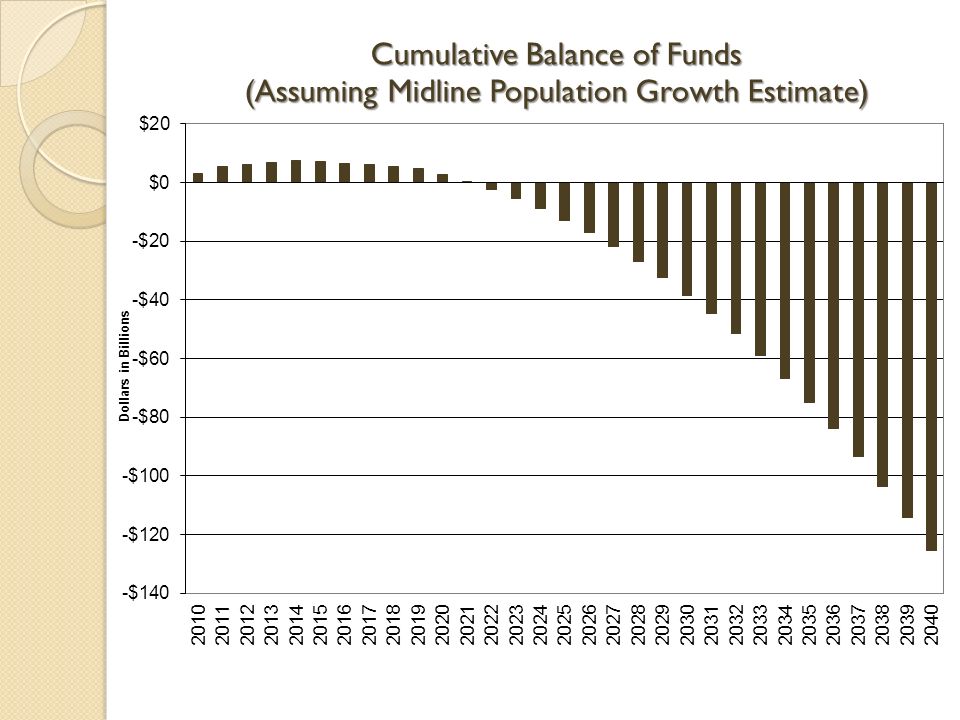
PROJECTED REVENUE AND EXPENDITURES Total Revenues Maintenance and Operating Expenditures New Capacity Expenditures Annual Balance of FundsCumulative Balance Fiscal Year 2010$8,758,866,295$5,719,566,241$0$3,039,300,054 2011$8,666,176,935$6,199,735,250$0$2,466,441,685$5,505,741,739 2012$7,331,042,188$6,565,611,249$0$765,430,938$6,271,172,677 2013$7,394,794,904$6,662,663,504$0$732,131,400$7,003,304,077 2014$7,455,331,884$6,788,181,923$0$667,149,961$7,670,454,038 2015$6,509,064,724$7,131,845,147$0-$622,780,423$7,047,673,614 2016$6,558,673,619$6,951,339,715$0-$392,666,095$6,655,007,519 2017$6,582,076,715$7,063,421,961$0-$481,345,245$6,173,662,274 2018$6,600,459,874$7,224,842,844$0-$624,382,971$5,549,279,303 2019$6,611,094,702$7,393,445,846$0-$782,351,144$4,766,928,159 2020$6,612,209,268$8,711,630,578$0-$2,099,421,310$2,667,506,849 2021$6,603,964,888$8,999,905,699$0-$2,395,940,811$271,566,037 2022$6,584,919,464$9,297,115,473$0-$2,712,196,009-$2,440,629,972 2023$6,553,222,123$9,636,769,543$0-$3,083,547,420-$5,524,177,391 2024$6,506,690,326$9,952,306,197$0-$3,445,615,871-$8,969,793,263 2025$6,442,514,351$10,319,739,231$0-$3,877,224,880-$12,847,018,142 2026$6,371,518,932$10,669,747,152$0-$4,298,228,221-$17,145,246,363 2027$6,293,285,063$10,933,478,274$0-$4,640,193,212-$21,785,439,575 2028$6,207,281,506$11,223,846,556$0-$5,016,565,050-$26,802,004,625 2029$6,113,058,615$11,634,934,560$0-$5,521,875,946-$32,323,880,570 2030$6,010,008,576$12,062,368,227$0-$6,052,359,651-$38,376,240,221 2031$5,960,528,848$12,381,798,447$0-$6,421,269,599-$44,797,509,820 2032$5,922,511,254$12,728,902,058$0-$6,806,390,804-$51,603,900,625 2033$5,895,448,048$13,209,382,882$0-$7,313,934,834-$58,917,835,459 2034$5,878,939,290$13,708,972,798$0-$7,830,033,508-$66,747,868,967 2035$5,872,534,080$14,228,432,867$0-$8,355,898,787-$75,103,767,754 2036$5,876,342,534$14,768,554,491$0-$8,892,211,957-$83,995,979,711 2037$5,884,909,720$15,330,160,627$0-$9,445,250,907-$93,441,230,618 2038$5,898,161,942$15,914,107,045$0-$10,015,945,103-$103,457,175,721 2039$5,911,436,995$16,521,283,637$0-$10,609,846,642-$114,067,022,363 2040$5,924,301,110$17,152,615,780$0-$11,228,314,670-$125,295,337,033 TOTAL:$201,791,368,771$327,086,705,804$0-$125,295,337,033

36
Questions?

37
David Ellis Research Scientist Texas Transportation Institute The Texas A&M University System College Station, Texas 77845 979.845.6165 d-ellis@tamu.edu

38
Other Slides

39
Annual Percent Increase in Texas: 1990 to 2007

40
Texas Motor Fuels Tax Adjusted for Inflation

41
Texas Motor Fuels Tax Adjusted by H.C.I.

42
Average Fleetwide Fuel Efficiency in Texas: Gasoline Powered Vehicles

43
Fuel Efficiency Adjusted Fuel Tax Paid (assuming 12,000 annual miles)
")
44
Historical and Projected Fuel Tax Revenues Texas

45
Over the next 20 years: VMT is projected to increase 33 percent Fuel tax revenue is projected to decrease 23 percent

46
Vehicle Miles Traveled in the United States (in millions): 1936 through 2009 (Source: Federal Highway Administration)
: 1936 through 2009 (Source: Federal Highway Administration)")
47
R-Squared Value - Price of Gasoline and Per Capita Consumption by Month August 1997 through July 2009

48
Year-Over-Year Percent Change in Consumption of Gasoline Per Capita Versus Year-Over-Year in Percent Change in Gasoline Price in Texas (All Months - August 1997 through July 2009)
")
Similar presentations
 RIPEC Study: Transportation at a Crossroads (2002) Growing Smart with Transit: A Report of the Transit 2020 Working.>")


 Fuel Efficiency.>")


>")