Download presentation
Presentation is loading. Please wait.

1
Maximal Reliability of Unit-Weighted Composites Peter M. Bentler University of California, Los Angeles SAMSI, NOV 05 In S. Y. Lee (Ed.) (in press). Handbook of Structural Equation Models.
 (in press). Handbook of Structural Equation Models..")
2
Reliability = Internal Consistency of the composite X based on p components

4
Since uniqueness = specificity + error, i.e.,

5
Under mild assumptions consistent with the above, Novick & Lewis (1967) showed that
 showed that")
7
This is not the only condition for

8
This Hoyt-Guttman-Cronbach α is by far the most widely used measure of the internal con- sistency reliability of a composite X. In prac- tice, one substitutes the sample covariance matrix S and its diagonal D S to get

9
Some Recent References Becker, G. (2000). Coefficient alpha: Some terminological ambiguities and related misconceptions. Psychological Reports, 86, 365-372. Bonett, D. G. (2003). Sample size requirement for testing and estimating coefficient alpha. Journal of Educational and Behavioral Statistics, 27, 335-340. Enders, C. K., & Bandalos, D. L. (1999). The effects of heterogeneous item distributions on reliability. Applied Measurement in Education, 12, 133-150. Green, S. B., & Hershberger, S. L. (2000). Correlated errors in true score models and their effect on coefficient alpha. Structural Equation Modeling, 7, 251-270. Hakstian, A. R., & Barchard, K. A. (2000). Toward more robust inferential procedures for coefficient alpha under sampling of both subjects and conditions. Multivariate Behavioral Research, 35, 427-456. Kano, Y., & Azuma, Y. (2003). Use of SEM programs to precisely measure scale reliability. In H. Yanai, A. Okada, K. Shigemasu, Y. Kano, & J. J. Meulman (Eds.), New developments in psychometrics (pp. 141-148). Tokyo: Springer- Verlag. Komaroff, E. (1997). Effect of simultaneous violations of essential tau- equivalence and uncorrelated error on coefficient alpha. Applied Psychological Measurement, 21, 337-348.
. Sample size requirement for testing and estimating coefficient alpha. Journal of Educational and Behavioral Statistics, 27, Enders, C. K., & Bandalos, D. L. (1999). The effects of heterogeneous item distributions on reliability. Applied Measurement in Education, 12, Green, S. B., & Hershberger, S. L. (2000). Correlated errors in true score models and their effect on coefficient alpha. Structural Equation Modeling, 7, Hakstian, A. R., & Barchard, K. A. (2000). Toward more robust inferential procedures for coefficient alpha under sampling of both subjects and conditions. Multivariate Behavioral Research, 35, Kano, Y., & Azuma, Y. (2003). Use of SEM programs to precisely measure scale reliability. In H. Yanai, A. Okada, K. Shigemasu, Y. Kano, & J. J. Meulman (Eds.), New developments in psychometrics (pp ). Tokyo: Springer- Verlag. Komaroff, E. (1997). Effect of simultaneous violations of essential tau- equivalence and uncorrelated error on coefficient alpha. Applied Psychological Measurement, 21,")
10
Miller, M. B. (1995). Coefficient alpha: A basic introduction from the perspectives of classical test theory and structural equation modeling. Structural Equation Modeling, 2, 255-273. Raykov, T. (1998). Coefficient alpha and composite reliability with interrelated nonhomogeneous items. Applied Psychological Measurement, 22, 375-385. Raykov, T. (2001). Bias of coefficient α for fixed congeneric measures with correlated errors. Applied Psychological Measurement, 25, 69-76. Schmitt, N. (1996). Uses and abuses of coefficient alpha. Psychological Assessment, 8, 350-353. Shevlin, M., Miles, J. N. V., Davies, M. N. O., & Walker, S. (2000). Coefficient alpha: A useful indicator of reliability? Personality & Individual Differences, 28, 229-237. Schmitt, N. (1996). Uses and abuses of coefficient alpha. Psychological Assessment, 8, 350-353. Yuan, K.-H., Guarnaccia, C. A., & Hayslip, B. J. (2003). A study of the distribution of sample coefficient alpha with the Hopkins Symptom Checklist: Bootstrap versus asymptotics. Educational & Psychological Measurement, 63, 5-23.
. Coefficient alpha and composite reliability with interrelated nonhomogeneous items. Applied Psychological Measurement, 22, Raykov, T. (2001). Bias of coefficient α for fixed congeneric measures with correlated errors. Applied Psychological Measurement, 25, Schmitt, N. (1996). Uses and abuses of coefficient alpha. Psychological Assessment, 8, Shevlin, M., Miles, J. N. V., Davies, M. N. O., & Walker, S. (2000). Coefficient alpha: A useful indicator of reliability. Personality & Individual Differences, 28, Schmitt, N. (1996). Uses and abuses of coefficient alpha. Psychological Assessment, 8, Yuan, K.-H., Guarnaccia, C. A., & Hayslip, B. J. (2003). A study of the distribution of sample coefficient alpha with the Hopkins Symptom Checklist: Bootstrap versus asymptotics. Educational & Psychological Measurement, 63,")
11
Some Advantages of Widely taught and known Simple to compute and explain Available in most computer packages is a lower bound to population internal consistency under reasonable conditions (not true of sample ) Not reliant on researcher judgments (i.e., same data, same result for everyone)
 Not reliant on researcher judgments (i.e., same data, same result for everyone)")
12
Note: Independence of researcher judgment is not totally correct Different covariance matrices, or scalings of the variables, yield different and hence different Sometimes alpha is computed from the correlation matrix, and not the covariance matrix, implying the sum X is a sum of standardized variables

13
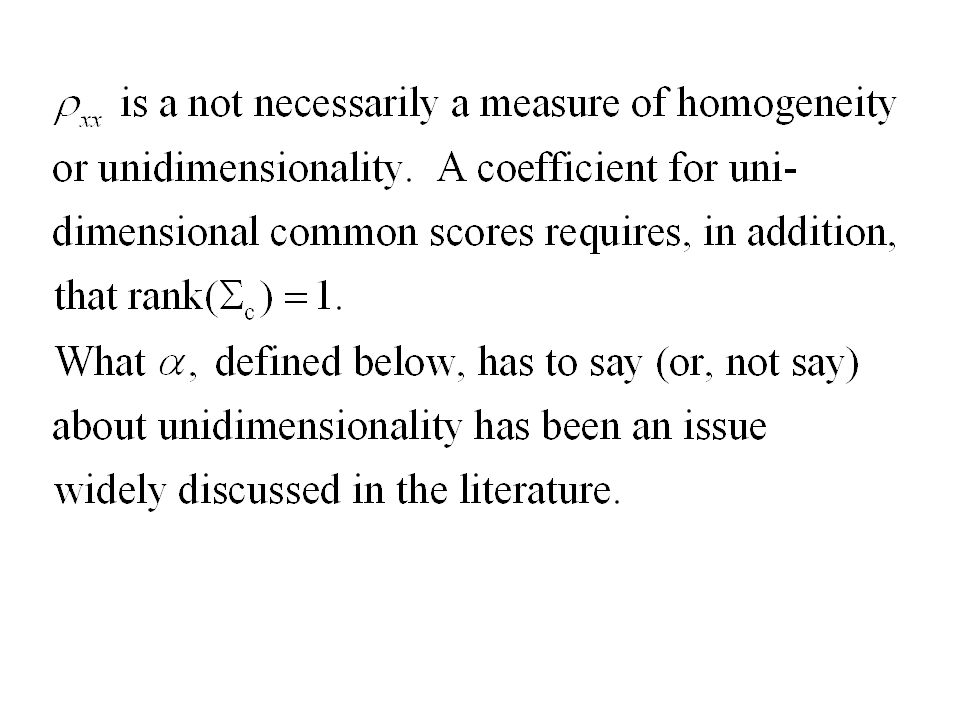
Some Disadvantages of α is not a measure of homogeneity or unidimensionality It may underestimate or overestimate uni- dimensional reliability Since it will overestimate reliability if, the average covariance, is spuriously high; or underestimate it if the average is spuriously low

14
This illustrates the advantages and disadvantages of alpha The plus: The average covariance is what it is, period. No judgment can change it. Hence, no judgment will change the reported. The minus: A researchers model of sources of variance does not influence the reported reliability (alpha) when, perhaps, it should. Some examples from Kano/Azuma (2003) illustrate this.
 when, perhaps, it should. Some examples from Kano/Azuma (2003) illustrate this..")
15
If for a one factor model and possibly correlated residuals ( not necessarily diagonal)
")
16
Three examples from Kano & Azuma (2003) showing alpha as accurate, and as an overestimate. 1-factor reliability (rho= omega) ignoring correlated errors can overestimate.
 ignoring correlated errors can overestimate..")
17
Alpha as a unidimensional lower-bound: the comparison of in a 1-factor model If, and is px1, is diagonal,. Example: McDonald (1999) showed with equality when
 showed with equality when.")
19
Thus, α is a good indicator of association but it is not clear what interesting sets of models it represents in the general case A model based coefficient such as provides a clear partitioning of variance, but it also can be (1) misleading (e.g., Kano -Azuma), (2) not relevant
 misleading (e.g., Kano -Azuma), (2) not relevant")
20
To give up α for a model-based coefficient, the model must be correct for Σ. That is, it should fit the data (say, sample covariance matrix S). I would conclude: If is computed, the researcher must also provide evidence of acceptability of the 1- factor model. If a modified estimator is computed, the researcher should provide an argument for the variance partition.
. I would conclude: If is computed, the researcher must also provide evidence of acceptability of the 1- factor model. If a modified estimator is computed, the researcher should provide an argument for the variance partition..")
21
Should the correlated error be part of the residual covariance Ψ (on left), or part of the common variance Σ c (on right)? Substantive reasoning should determine the variance partitioning. This is more than just model fit.

22
What other model-based coefficients could be used instead? Arbitrary latent variable model (Raykov & Shrout, 2002; EQS 6) Dimension-free lower bound (Bentler, 1972; bias correction Shapiro & ten Berge, 2000) Greatest lower bound (Woodhouse & Jackson, 1977; Bentler & Woodward, 1980 etc.; ten Berge, Snijders, & Zegers, 1981; bias correction Li & Bentler, 2001)
 Dimension-free lower bound (Bentler, 1972; bias correction Shapiro & ten Berge, 2000) Greatest lower bound (Woodhouse & Jackson, 1977; Bentler & Woodward, 1980 etc.; ten Berge, Snijders, & Zegers, 1981; bias correction Li & Bentler, 2001).")
23
Arbitrary LV Model

24
Dimension-free Lower Bound

25
Greatest Lower Bound This is a constrained version of the dimension-free coefficient. In addition to

27
Maximal Unidimensional Reliability The problem with α and the multi- dimensional coefficients seems to be that they do not represent unidimensional reliability Although not obvious, unidimensional reliability can be defined for multi- dimensional latent variable models. That is the main new result in this talk.

28
Repeating the Basic Setup X i = T i + E i, X = T + E,

29
Can we have something like 1-Factor Based Reliability when the latent variables are multidimensional?

30
Maximal Unit-weighted Reliability (p x k) for some k (small k < or large k) for some acceptable k-factor model, where is (px1) and is (px(k-1)) contains unrestricted free parameters., that is, the k-1 columns of sum to zero. contains free parameters subject to (k-1)(k-2)/2 restrictions (usual EFA identification conditions)
(k-2)/2 restrictions (usual EFA identification conditions).")
31
Reliability under this Parameterization X is based on 1 factor!

32
This is Maximal Unit-Weighted Reliability and let t be a normal vector Then the factor loading vectorthat maximizes is given by and the residual factors where have zero column sums

33
Applications to Arbitrary Structural Models Any structural model with additive errors: Linear structural model with additive errors: Let with Greatest lower bound:

34
EFA Example (Its all in EQS) /TITLE Maximum Reliability EFA Model Setup Nine Psychological Variables /SPECIFICATIONS VARIABLES= 9; CASES=101; MATRIX=COVARIANCE; METHOD=ML; /EQUATIONS V1=*F1+*F2+0F3+E1; V2=*F1+*F2+*F3+E2; V3=*F1+*F2+*F3+E3; V4=*F1+*F2+*F3+E4; V5=*F1+*F2+*F3+E5; V6=*F1+*F2+*F3+E6; V7=*F1+*F2+*F3+E7; V8=*F1+*F2+*F3+E8; V9=*F1+*F2+*F3+E9;
 /TITLE Maximum Reliability EFA Model Setup Nine Psychological Variables /SPECIFICATIONS VARIABLES= 9; CASES=101; MATRIX=COVARIANCE; METHOD=ML; /EQUATIONS V1=*F1+*F2+0F3+E1; V2=*F1+*F2+*F3+E2; V3=*F1+*F2+*F3+E3; V4=*F1+*F2+*F3+E4; V5=*F1+*F2+*F3+E5; V6=*F1+*F2+*F3+E6; V7=*F1+*F2+*F3+E7; V8=*F1+*F2+*F3+E8; V9=*F1+*F2+*F3+E9;")
35
/VARIANCES F1 TO F3 = 1.0; E1 TO E9 =.5*; /CONSTRAINTS (V1,F2)+(V2,F2)+(V3,F2)+(V4,F2)+(V5,F2) +(V6,F2)+(V7,F2)+(V8,F2)+(V9,F2)=0; (V2,F3)+(V3,F3)+(V4,F3)+(V5,F3)+(V6,F3) +(V7,F3)+(V8,F3)+(V9,F3)=0; /MATRIX 1.00.75 1.00.78.72 1.00.44.52.47 1.00.45.53.48.82 1.00.51.58.54.82.74 1.00.21.23.28.33.37.35 1.00.30.32.37.33.36.38.45 1.00.31.30.37.31.36.38.52.67 1.00 /END
+(V2,F2)+(V3,F2)+(V4,F2)+(V5,F2) +(V6,F2)+(V7,F2)+(V8,F2)+(V9,F2)=0; (V2,F3)+(V3,F3)+(V4,F3)+(V5,F3)+(V6,F3) +(V7,F3)+(V8,F3)+(V9,F3)=0; /MATRIX /END")
36
for 9 Psychological Variables Variable Number 1-Factor Model 3-Factor Model 1.636.727 2.697.738 3.667.754 4.867.789 5.844.767 6.879.803 7.424.492 8.466.597 9.462.635 Sum5.9426.302

Similar presentations


>")


 address: Telephone: (27) 2233 Dont hesitate to get in touch.>")
 Patrick Sturgis University of Surrey.>")


>")


