Download presentation
Presentation is loading. Please wait.

1
Characterizing non-pigment canopy biochemistry from imaging spectrometer data for studying ecosystem processes Gregory P. Asner, Mary E. Martin, Scott V. Ollinger, & Carol A. Wessman Raymond F. Kokaly U.S. Geological Survey Ohio State Univ.

2
General Research Goals
To quantify non-pigment biochemistry at the leaf and canopy levels using reflectance spectroscopy Apply knowledge of leaf spectroscopy for detailed characterization of vegetation Quantify canopy biochemistry to increase understanding of fine-scale variations in ecosystem processes over large areas

4
Types of Remote Sensing
Electromagnetic Wavelength (mm) Passive Systems Active Ultraviolet (UV) 0.4 – 0.7 Visible 0.7 – 1.4 1.4 – 3.0 Near-Infrared Shortwave Infrared 3.0 – 1,000 Infrared 1,000- 300,000 Microwave LIDAR Airborne Cameras Radiometers Spectrometers Radar (SAR)
 Passive. Systems. Active Ultraviolet (UV) 0.4 – 0.7. Visible. 0.7 – – 3.0. Near-Infrared. Shortwave Infrared. 3.0 – 1,000. Infrared. 1, ,000. Microwave. LIDAR. Airborne Cameras. Radiometers. Spectrometers. Radar (SAR)")
5
Imaging Spectrometers
EO-1 Spacecraft Satellite-based Imaging Spectroscopy Data: EO-1 Hyperion Airborne HyMap Probe CASI AVIRIS NASA ER-2

6
Trends in quantifying non-pigment leaf biochemistry
Greater understanding of lab, field and remote sensing level spectra in relation to biochemical composition Increased use of full spectrum or specific biochemical absorption features to characterize vegetation Greater application of imaging spectroscopy to understand ecosystem processes

7
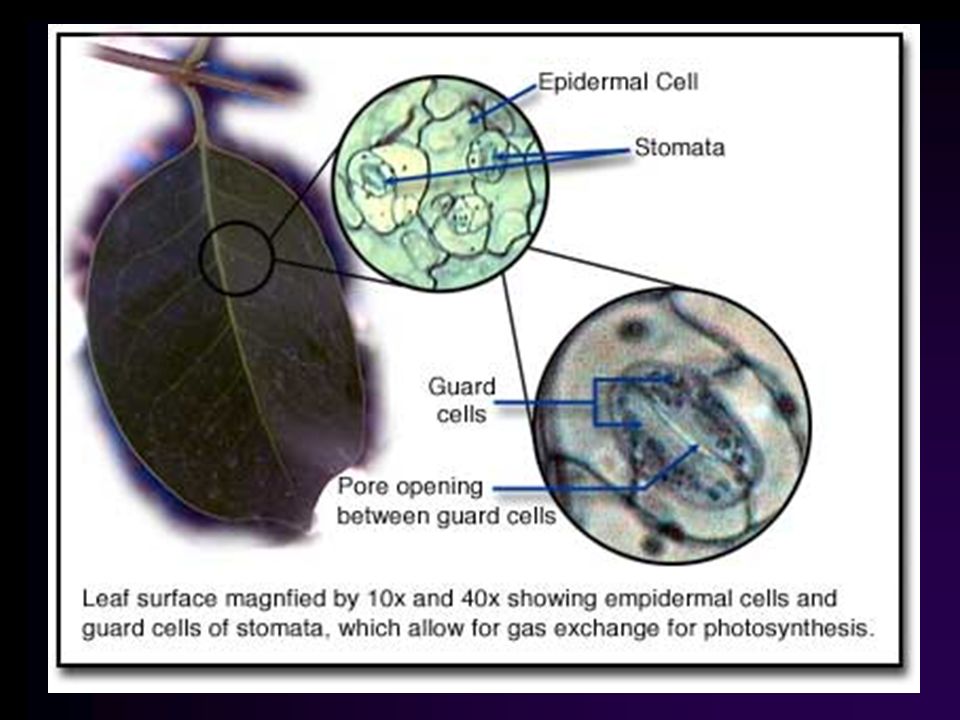
Understanding vegetation spectra in relation to biochemical composition
Water Nitrogen (in chlorophylls and proteins) Lignin and Cellulose Non-Photosynthetic Vegetation
 Lignin and Cellulose. Non-Photosynthetic Vegetation.")
8
Kokaly, REMOTE SENS. ENVIRON. 84:437-456 (2003)
")
9
Water Water content/potential is a limiting factor for plant transpiration (photosynthesis and carbon gain) and thus growth and development
 and thus growth and development.")
11
Kokaly and Clark, REMOTE SENS. ENVIRON. 67:267–287 (1999)
")
12
Spectroscopic Estimates of Leaf/Canopy Water
Leaf/Canopy Liquid Water Thickness Gao & Goetz, 1994 Canopy Equivalent Water Thickness Green et al., 1991 & Roberts et al. 1997 Canopy Relative Water Content Serrano et al. 2000 Foliar Water Potential Stimson et al. 2005

13
Serrano et al., REMOTE SENS. ENVIRON. 74:570–581 (2000)
")
14
NDWI = (R860 - R1240) (R860 + R1240) NDII = (R819 - R1649) (R819 + R1649)
 (R860 + R1240) NDII = (R819 - R1649) (R819 + R1649)")
15
Foliar Water Potential (MPa)
Stimson et al., Remote Sensing of Environment 96 (2005) 108– 118
 108– 118.")
16
Leaf (Lab) Canopy (AVIRIS) 980 1200 nm nm 850 1350 1850
Clark et al., Remote Sensing of Environment 96 (2005) 375 – 398
 375 – 398.")
17
Nitrogen By dry weight, very low abundance in leaves, only 0.5 to 4%
Present in important biochemical constituents of plants Chlorophyll Protein Linked by field studies to rates of ecosystem functioning (carbon fixation) and widely used in ecosystem models
 and widely used in ecosystem models.")
18
Nitrogen in Proteins Proteins composed of amino acids ranging from a 100 to 100,000 in number

19
RuBisCO Ribulose-1,5-bisphosphate carboxylase/oxygenase, catalyzes the first major step of carbon fixation RuBisCO is the most abundant protein in leaves (maybe the most abundant on Earth).
.")
20
Kokaly, REMOTE SENS. ENVIRON. 75:153–161 (2001)
")
21
Kokaly, REMOTE SENS. ENVIRON. 75:153–161 (2001)
")
22
Kokaly and Clark, REMOTE SENS. ENVIRON. 67:267–287 (1999)
")
23
Nitrogen in Chlorophyll

24
Mutanga et al., Remote Sensing of Environment 96 (2005) 108– 118
 108– 118")
25
Biochemical Components of Plants
Cellulose Cellulose monomers (β-glucose) are linked together through 1→4 glycosidic bonds Cellulose is a common material in plant cell walls Cellulose is the most abundant form of living terrestrial biomass (R.L. Crawford 1981).
 are linked together through 1→4 glycosidic bonds. Cellulose is a common material in plant cell walls. Cellulose is the most abundant form of living terrestrial biomass (R.L. Crawford 1981).")
26
Biochemical Components of Plants
Lignin 10% to 40% by dry weight Lignin is a large macromolecule with molecular mass in excess of 10,000 amu. Structural component of plant cell walls. It is hydrophobic and aromatic in nature. Lignin concentration in litter has strong influence on ecosystem processes

27
Lignin Cellulose Since their chemical structures are different, we expect different spectra and that Is indeed what we see. Though their spectral features overlap which complicates Things when looking at the spectrum of an intact leaf or plant. What we see is That the lignin absorption in the 2.1 micron regoin is at slightly longer wavleengths And the 2.3 micron feature in cellulose is a doublet (two dips) compared to lignin’s Single absorption feature.
 compared to lignin’s. Single absorption feature.")
28
Kokaly et al., Remote Sensing of Environment, in press
= 3.8 Grass Cellulose:Lignin Pine Cellulose:Lignin = 1.5 What we found is that pine needles have relatively higher lignin-cellose ratios compared To other dry vegetation in the area – mostly dry grass. And we see this shift in the pine Spectra to loner wavelength for the pine sample and the doublet nature of the 2.3 micron Absorption for the grass spectrum. This is from lab data. Kokaly et al., Remote Sensing of Environment, in press

29
Apply knowledge of leaf spectroscopy for detailed characterization of vegetation

30
Cerro Grande Fire Los Alamos, New Mexico
The case study we will look at for these materials is a conifer forest that burned In New Mexico, near Los Alamos, which is the home of atomic research. Obviously there Was a lot of concern about the fire’s effect on the area (it’s effect on materials that might Have been say nuclear material that may have been misplaced but mostly concern about The post-fire impacts from erosion and landslides on the lab’s facilities.

31
Here is what a burned conifer forest looks like
Here is what a burned conifer forest looks like. We can see a lot of scorched trees that Have been heated by the fire. We were interested in detecting these trees and quantifying What percentage of the surface was affected in that way. The heat pulse actually penetrates Further than this orange ring, the trees just a ways inward suffer from water loss but not Chlorophyll degredation. So we needed to examine dry pine needles in relation to other Dry vegetation to see if we could identify it.

32
Kokaly et al., Remote Sensing of Environment, in press
=3.8 Grass Cellulose:lignin Pine Cellulose:lignin =1.5 What we found is that pine needles have relatively higher lignin-cellose ratios compared To other dry vegetation in the area – mostly dry grass. And we see this shift in the pine Spectra to loner wavelength for the pine sample and the doublet nature of the 2.3 micron Absorption for the grass spectrum. This is from lab data. Kokaly et al., Remote Sensing of Environment, in press

33
Kokaly et al., Remote Sensing of Environment, in press
AVIRIS Dry Grass AVIRIS Dry Pine In the AVIRIS data we see these same spectral differences. The spectra from pixels containing dry conifers have a broadened 2.1 micron feature and a stronger central absorption in the 2.3 micron feature when compared to pixels from areas where dry straw matting was placed on the surface. Thus, the effects of chemistry on leaf level spectra are also present in AVIRIS pixels. This highlights the real power of imaging spectroscopy, that is the ability to link spectral differences to chemistry and thus discriminate materials or identify substances. Having a highly capable and reliable sensor is crucial to such research. Kokaly et al., Remote Sensing of Environment, in press

34
Results: AVIRIS Maps Green Vegetation Mineral/Ash Mineral-1mm Mineral-2mm Dry Conifer Dry & Green Conifer Straw matting Ash/Charcoal & Green grass Again by comparing the pixels to the spectra in the library we can look for these materials. We see Quite a diversity in materials in the burned area. Kokaly et al., Remote Sensing of Environment, in press

35
Kokaly et al., Remote Sensing of Environment, in press
Green Vegetation Mineral/Ash Mineral-1mm Mineral-2mm Dry Conifer Dry & Green Conifer Straw matting Ash/Charcoal & Green grass Looking in more detail at the severely burned area in the center of the image. We can see The dry trees Kokaly et al., Remote Sensing of Environment, in press

36
Kokaly et al., Remote Sensing of Environment, in press
This image shows the zoning that occurs at the boundary of severely burned areas. Why is this Important, well the dry needles will fall soon and contribute to nutrient cycling and these Zones are different from the completely burned areas here and the relatively unaffected Trees on the other side. A recent study by a USGS colleague has also found that these Moderately affected trees are important habitat for avian species following fire. 30m High Burn Severity Kokaly et al., Remote Sensing of Environment, in press

37
Analysis of spectral shape (full spectrum and/or absorption features) for vegetation characterization Multiple Endmember Spectral Mixture Models: Roberts, et al. (1998) Remote Sens. Environ. 65:267–279 Monte Carlo spectral unmixing model: Asner and Heidebrecht (2002) Int. J. Remote sensing 23: 3939–3958 Tetracorder, absorption feature analysis: Clark, et al. (2003) . J. Geophys. Research 108 (E12): 5-1 to 5-44
 Remote Sens. Environ. 65:267–279. Monte Carlo spectral unmixing model: Asner and Heidebrecht (2002) Int. J. Remote sensing 23: 3939–3958. Tetracorder, absorption feature analysis: Clark, et al. (2003) . J. Geophys. Research 108 (E12): 5-1 to")
38
Understanding ecosystem processes by quantifying canopy biochemistry
Wessman, et al. (1988) Nature 333: 154–156 Asner and Heidebrecht (2003) IEEE Trans. on Geoscience & Remote Sensing 41: Smith, et al. (2002) Ecological Applications 12: 1286–1302 Ollinger and Smith, (2005) Ecosystems 8: 760–778 Asner et al. (2005), Remote Sensing of Environment 96: 497–508
 Nature 333: 154–156. Asner and Heidebrecht (2003) IEEE Trans. on Geoscience & Remote Sensing 41: Smith, et al. (2002) Ecological Applications 12: 1286–1302. Ollinger and Smith, (2005) Ecosystems 8: 760–778. Asner et al. (2005), Remote Sensing of Environment 96: 497–508.")
39
Asner and Heidebrecht, Int. J. remote sensing, 2002, vol. 23, no

40
Non-Photosynthetic Vegetation and Shrubland Ecosystems
Asner and Heidebrecht, IEEE Trans. on Geoscience & Remote Sensing (2003), 41:
, 41:")
41
Kokaly, REMOTE SENS. ENVIRON. 75:153–161 (2001)
In lab spectra we can see that high N leaves have stronger absorptions at the Protein wavelengths Kokaly, REMOTE SENS. ENVIRON. 75:153–161 (2001)
")
42
Mutanga et al., Remote Sensing of Environment 96 (2005) 108– 118
 108– 118")
43
V Asner and Vitousek, Proc. Nat. Acad. Sci., Vol 102 , 2005.

44
Smith et al., Ecological Applications, 12(5), 2002, 1286–1302
r2-=0.71 See=0.19 Smith et al., Ecological Applications, 12(5), 2002, 1286–1302
, 2002, 1286–1302.")
45
Smith et al., Ecological Applications, 12(5), 2002, 1286–1302
, 2002, 1286–1302")
46
Ollinger and Smith, Ecosystems (2005) 8: 760–778
Alsoworked withwood production Ollinger and Smith, Ecosystems (2005) 8: 760–778
 8: 760–778.")
47
Ollinger and Smith, Ecosystems (2005) 8: 760–778
 8: 760–778")
48
Ollinger and Smith, Ecosystems (2005) 8: 760–778
 8: 760–778")
49
Remaining Challenges/ Future Directions
Overlapping of biochemical absorption features Leaf water masking effect Understanding protein/lignin/cellulose changes which all affect the 2.1 and 2.3 mm features Quantification of other biochemicals (starch, tannin, hemi-cellulose, phosphorous) Independent-site/Multi-site validation Atmospheric correction needs improvement to lessen impact of residual features
 Independent-site/Multi-site validation. Atmospheric correction needs improvement to lessen impact of residual features.")
Similar presentations


 with height affect LAI estimates? LAI can be calculated.>")


