Download presentation
Presentation is loading. Please wait.

1
QC/QA and Diva Products in Mediterranean Sea EMODNET Chemistry 2 Meeting on ODV QC and Diva Products Ifremer Headquarter, Paris, 3 September 2014 Sissy Iona, HCMR-HNODC

2
Summary Regional aggregation, QC and validation of the first harvested nutrients data (June 2014, Plenary) – With ODV Version 4.6.2 Regional data products (June 2014, Plenary) – horizontal interpolated maps, observations distributions and the related error maps – trends identification and detection QC Report (July 2014) Feedback from data providers (July-August 2014)
 – With ODV Version Regional data products (June 2014, Plenary) – horizontal interpolated maps, observations distributions and the related error maps – trends identification and detection QC Report (July 2014) Feedback from data providers (July-August 2014)")
3
QC/QA Methodology Format errors that detected at the "initial data" were corrected. The “initial data” entry in ODV resulted in six "initial ODV collections" with primary variables: depth [m], pressure [db], time [years since 0000-01-01], and depth below seabed [m]. Each separate labeled variable of the "initial ODV collections" was mapped with the first priority nutrients products in the water column and the “good” data exported and saved at separate ODV spreadsheets (called “good initial data” hereafter). The “good initial data” were aggregated, validated and analyzed with DIVA tool for the nutrient products preparation. QC report and lists of detected and possible outliers were sent to data originators for confirmation, corrections or updates
. The good initial data were aggregated, validated and analyzed with DIVA tool for the nutrient products preparation. QC report and lists of detected and possible outliers were sent to data originators for confirmation, corrections or updates.")
4
ODV Data Processing (version 4.6.2) Selection and filter criteria – Mapping of nutrients parameters with P35 – Stations selection View>Station Selection Criteria>Availability – Data filter Export>Station data Sample Selection Criteria>Quality>Acceptable Quality Flags=0, 1, 2, 6 After this export, data values with flags other than 0, 1, 2 and 6 remained in the data sets if the primary variable is flagged as good. Therefore, the above spreadsheets were imported again in ODV and during the second export the same data quality filters were applied again to all variables (Sample Selection Criteria>Quality>Acceptable Quality Flags=0, 1, 2, 6) the derived variables, only data with QF=1 were selected – Data availability in stations Stations empty of data are not counted (Station Selection Criteria>Availability> select the nutrient parameter) Units Conversions
 the derived variables, only data with QF=1 were selected – Data availability in stations Stations empty of data are not counted (Station Selection Criteria>Availability> select the nutrient parameter) Units Conversions.")
5
The units conversions from [µg/l] to [µmol/l] were done manually using the ODV “Expression” derived variables: View>Derived Variables>Expressions, Derivatives, Integrals>Expression: Label: Ammonium, Units: µmol/l, Digits: 4 – for NH4, NOx,NO3 and NO2 Expression in Postfix Notation: #1 14.00670 / – for SiO4 Expression in Postfix Notation: #1 92.0831 / – for PO4Expression in Postfix Notation: #1 30.97376 / The units conversions from [µmol/kg] to [µmol/l] is done by ODV during the manual aggregation through the import options dialogue (Import options>Variables Association>Convert> select suitable conversion>Any [.../kg]>>Any [.../l])
![The units conversions from [µg/l] to [µmol/l] were done manually using the ODV Expression derived variables: View>Derived Variables>Expressions, Derivatives, Integrals>Expression: Label: Ammonium, Units: µmol/l, Digits: 4 – for NH4, NOx,NO3 and NO2 Expression in Postfix Notation: # / – for SiO4 Expression in Postfix Notation: # / – for PO4Expression in Postfix Notation: # / The units conversions from [µmol/kg] to [µmol/l] is done by ODV during the manual aggregation through the import options dialogue (Import options>Variables Association>Convert> select suitable conversion>Any [.../kg]>>Any [.../l])](http://images.slideplayer.com/24/7376482/slides/slide_5.jpg "The units conversions from [µg/l] to [µmol/l] were done manually using the ODV Expression derived variables: View>Derived Variables>Expressions, Derivatives, Integrals>Expression: Label: Ammonium, Units: µmol/l, Digits: 4 – for NH4, NOx,NO3 and NO2 Expression in Postfix Notation: # / – for SiO4 Expression in Postfix Notation: # / – for PO4Expression in Postfix Notation: # / The units conversions from [µmol/kg] to [µmol/l] is done by ODV during the manual aggregation through the import options dialogue (Import options>Variables Association>Convert> select suitable conversion>Any [.../kg]>>Any [.../l])")
6
Applied QC checks Broad range control checks: – High values compared with the existing climatological ranges were detected (http://www.ifremer.fr/sismer/program/medar/htql/region_param_m edar.htql?CODE=AMON) but kept because they are located in coastal areas, lagoons, or estuaries.http://www.ifremer.fr/sismer/program/medar/htql/region_param_m edar.htql?CODE=AMON – High values and equal to defaults like 999.99 or 999 were flagged from 0 or 1 to bad (4). – Values equal to or close to defaults like 9.9 or 99.99 but very far from the successive layers were flagged from 0 or 1 to questionable (3) because they were considered as rounded values. – Negatives were flagged from 0 or 1 to bad (4) – Zero values have been flagged from 0 or 1 to bad (4) and excluded from the first products versions. Partners have been asked to provide the lower detection limits so as this information is not lost from DIVA analysis. No checks for duplicates vertical levels (as DIVA average these doubles entries) No Spikes detection was applied
 because they were considered as rounded values. – Negatives were flagged from 0 or 1 to bad (4) – Zero values have been flagged from 0 or 1 to bad (4) and excluded from the first products versions. Partners have been asked to provide the lower detection limits so as this information is not lost from DIVA analysis. No checks for duplicates vertical levels (as DIVA average these doubles entries) No Spikes detection was applied.")
7
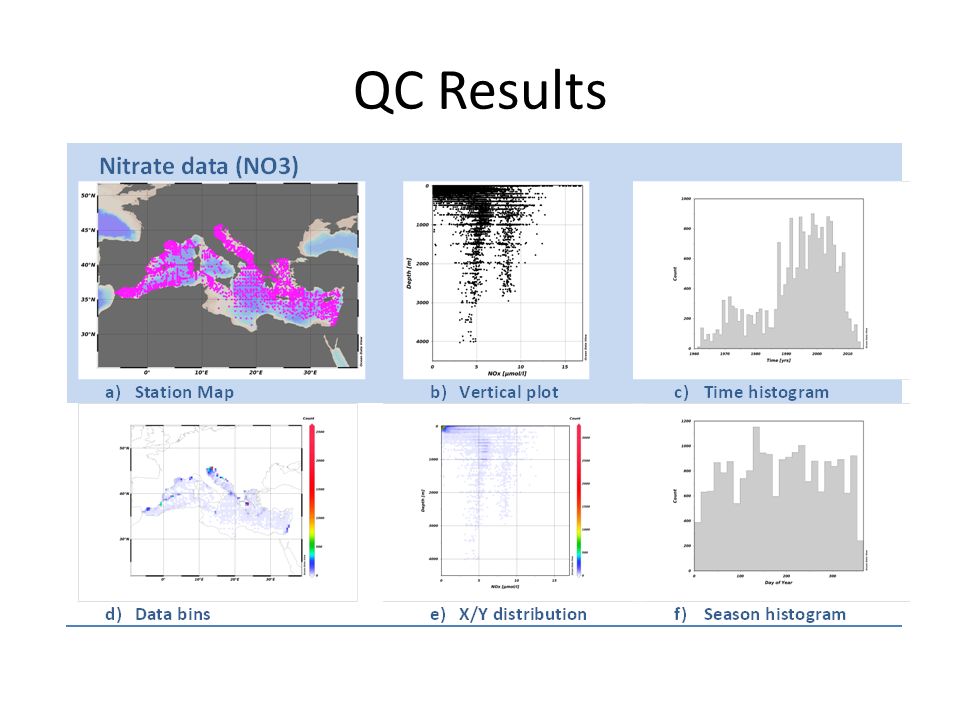
QC Results

9
4 MSFD regions in Mediterranean (one or more meshes ?) Diva Analysis - Mesh
 Diva Analysis - Mesh")
10
Analysis & errors fields areas of poor data coverage will be masked

11
Analysis parameters ~output/3Danalysis/MetaDataXMLs/NO3.Textinfo.txt

12
Analysis & errors fields Disregard these areas also?

13
Other results

14
Detection of trends 10 years moving windows (or other time frame) to reveal long term variabilities Centered in the middle of the decade 1970 until 1979 as 1975 1971 until 1980 as 1976 …. Seasonal Analysis January to March as winter April to June as spring …. Reference field Climatic seasonal from all available years (with detrending for removal of uneven spatial distribution in time) Without detrending
 Without detrending.")
15
Mean: 0.6000 Std: 0.0736 Detection of trends Mean summer NO3 at first 10 m, over the area N43.5-46, E12-15

16
Regional QC errors reports sent to OGS and all the rest originators (Italy) CNR (Italy) – Istituto di Scienze Marine – Torregrande-Oristano IMS (Turkey) IEO (Spain) NIB (Slovenia) RIHMI-WDC (Russia) IOLR, ISRAMAR (Israel) PANGAEA IFREMER (France) OC-UCY (Cyprus) IOF (Croatia) HCMR/HNODC (Greece) UMT.IOI.PO (Malta)
 CNR (Italy) – Istituto di Scienze Marine – Torregrande-Oristano IMS (Turkey) IEO (Spain) NIB (Slovenia) RIHMI-WDC (Russia) IOLR, ISRAMAR (Israel) PANGAEA IFREMER (France) OC-UCY (Cyprus) IOF (Croatia) HCMR/HNODC (Greece) UMT.IOI.PO (Malta)")
17
Responses IMS – trying to clarify with chemists for which parameters zero values are accepted and for which not (for example it is normal to report oxygen = 0 for samples from the H2S zone in Black Sea) – NH4 - 0.05 uM – NO2 - 0.01 uM RIHMI – This is data from UkrNCEM (former Odessa brunch SOI) – I discussed this problem with UcrNCEM for Atlantic ocean – These cruises reports have been prepared by software. If observations are not, than in report were "zero". It is proposing no bring these values for analysis

18
Responses IOF – LOQ = 0.033, LOQ/2=0.0165 – Replaced in local database IOLR – Confirmed that all negative values as well as 0 values are below detection level – detected levels before 2000 are not known PHOS 0.008 umol/l NTRA 0.08 umol/l NTRI 0.08 umol/l SLCA 0.05 umol/l – we will change all negative values to positive values with QC=6 (BD). We also change all 0 values to values of current detection levels with QC=6 (BD).
..")
19
Responses IEO – We have been revising data according to your annexes. Some changes in depths values have been done, as well as in some data/flags. – Some zero values in nutrients have been eliminated (and re-flagged to QF=9) because there were historical errors – But main of them remains unchanged, especially in surface or near-surface layers. As far as we know (according with the info we keep on the surveys) "0.00" are real analytical values and we have to keep them unchanged – we would try to change them to LOC/2 if we find info enough (perhaps in the future if we recover historical information about it). Anyway, if you decide flagging them as QF=4 in order to perform the analysis and DIVA maps, it is ok for us.
 because there were historical errors – But main of them remains unchanged, especially in surface or near-surface layers. As far as we know (according with the info we keep on the surveys) 0.00 are real analytical values and we have to keep them unchanged – we would try to change them to LOC/2 if we find info enough (perhaps in the future if we recover historical information about it). Anyway, if you decide flagging them as QF=4 in order to perform the analysis and DIVA maps, it is ok for us..")
20
Responses OGS – collecting info and opinions from the Adriatic originators for keeping or not the zero values OC-UCY (only some format errors) – we will correct the format naming at our local data
 – we will correct the format naming at our local data")
Similar presentations
 EMODNET Chemistry 2 - 4 th Steering Committee, 2-3 December 2014,>")
, Sissy Iona (HCMR-HNODC)>")


 Review developments over last year Current status Future work.>")

, 17-18 June 2014 Sissy Iona, HCMR-HNODC.>")


, 3-5 June 2013 Sissy Iona, HCMR-HNODC.>")
, 20-21 January 2014 WP 1 : DATA COLLECTION AND METADATA COMPILATION IN ATLANTIC SEA.>")


 1 st Expert Meeting introduction June 2014 Split, Croatia Matteo Vinci and Alessandra Giorgetti OGS, Trieste.>")

