Download presentation
Presentation is loading. Please wait.

1
The Young Stand Thinning and Diversity Study Stands not thinned (4 reps) Some thinned to maximize timber volume (4 reps) Some thinned to increase heterogeneity (4 reps) Some thinned to accelerate tree growth (4 reps)
 Some thinned to maximize timber volume (4 reps) Some thinned to increase heterogeneity (4 reps) Some thinned to accelerate tree growth (4 reps)")
3
Sampling Dead Wood Sampled dead wood in 1996/97 and 2006 using line intercept transect sampling at fixed plots. 1996/97 = pre-existing wood & recruited wood

4
TACLocationTreatment # Transects / TAC 1996/972006 1Cougar ReservoirControl233 2 Cougar Reservoir Heavy133 3 Cougar Reservoir Light193 4 Cougar Reservoir Gaps306 5Mill CreekControl253 6 Mill Creek Heavy183 7 Mill Creek Light263 8 Mill Creek Gaps336 9 Christy Flats Control233 10 Christy Flats Heavy153 11 Christy Flats Light243 12 Christy Flats Gaps306 13 Sidewalk Creek Control173 14 Sidewalk Creek Heavy103 15 Sidewalk Creek Light153 16 Sidewalk Creek Gaps306 Total number of transects:35160

5
CWD CharacteristicControlLight thin Thin with gapsHeavy thinP Pre-existing piece volume(m3/ha)425 (131)402.3 (131.8)380.6 (95.3)370.0 (54.4)0.8912 New piece volume4.8 (9.50)B 28.5 (19.0)AB36.4 (10.6)A22.8 (7.0)AB0.0211 Total piece volume429.7 (133.3)430.8 (126.1)417.0 (84.8)392.8 (57.0)0.9507 Thinning added 5-10% more dead wood volume, but the dead wood volume was dominated by pre-existing pieces
425 (131)402.3 (131.8)380.6 (95.3)370.0 (54.4) New piece volume4.8 (9.50)B 28.5 (19.0)AB36.4 (10.6)A22.8 (7.0)AB Total piece volume429.7 (133.3)430.8 (126.1)417.0 (84.8)392.8 (57.0) Thinning added 5-10% more dead wood volume, but the dead wood volume was dominated by pre-existing pieces")
6
How many samples are needed to estimate dead wood volume?

7
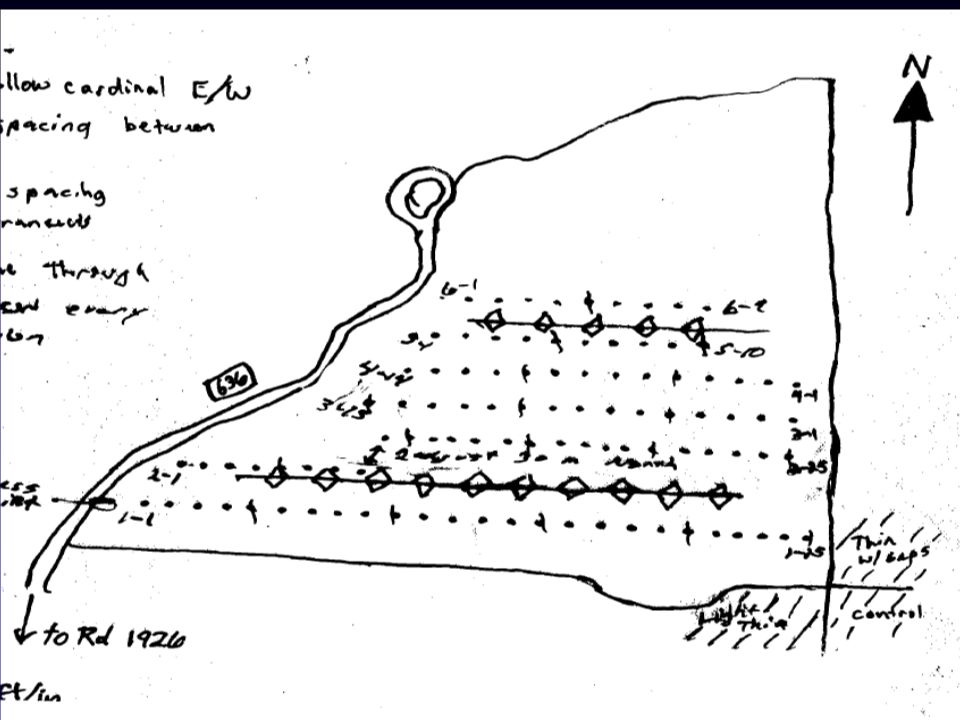
Small Mammals sampled during fall 2007 and 2008 50 Sherman live traps in variable-length transects, 20-m spacing 25 Tomahawk live traps set on the ground at alternating stations 25 Tomahawk live traps attached to tree boles at alternating stations

9
Trapping at each site occurred over a 4-day period during mid September through mid November. Traps were baited with rolled oats, peanut butter and sunflower seeds Cotton batting was placed in all traps to provide thermal cover for captured mammals. Two grids in each block were sampled simultaneously and the other two grids in the same block were sampled in the following week. The order for sampling grids within blocks was random and blocks were sampled sequentially. Trapping Protocols

10
Traps were checked twice daily to reduce mortalities

12
Animals were removed from the traps, and ear tagged

14
All animals were weighed and then released at the point of capture

15
SpeciesControlHeavyLightGapsTOTAL Deer mouse2557246096192207 Townsend's chipmunk4447748118032832 Trowbridge's shrew132346071297 N. Flying squirrel202227845347 Red-backed vole62274030159 Creeping vole411242160 Pacific shrew466221690 W. spotted skunk1623324 Coast mole14000 Vagrant shrew11125 Douglas' squirrel1511623 Snowshoe hare20002 California ground squirrel002911 Ermine10315 Shrew-mole40015 Bushy-tailed woodrat04307 Pacific Jumping Mouse02002 Brush rabbit01001 TOTAL CAPTURES11841613166716276091 TOTAL SPECIES1413 18

18
Correlations between estimated abundance using Program MARK and capture rates (per 1000 trap nights) 20072008 Flying Squirrel0.960.97 Townsend's chipmunk0.850.92 Deer mouse0.810.95 Red-backed vole0.991.00
 Flying Squirrel Townsend s chipmunk Deer mouse Red-backed vole")
19
Many species had too few captures to analyze Coast moles were only captured on control sites

21
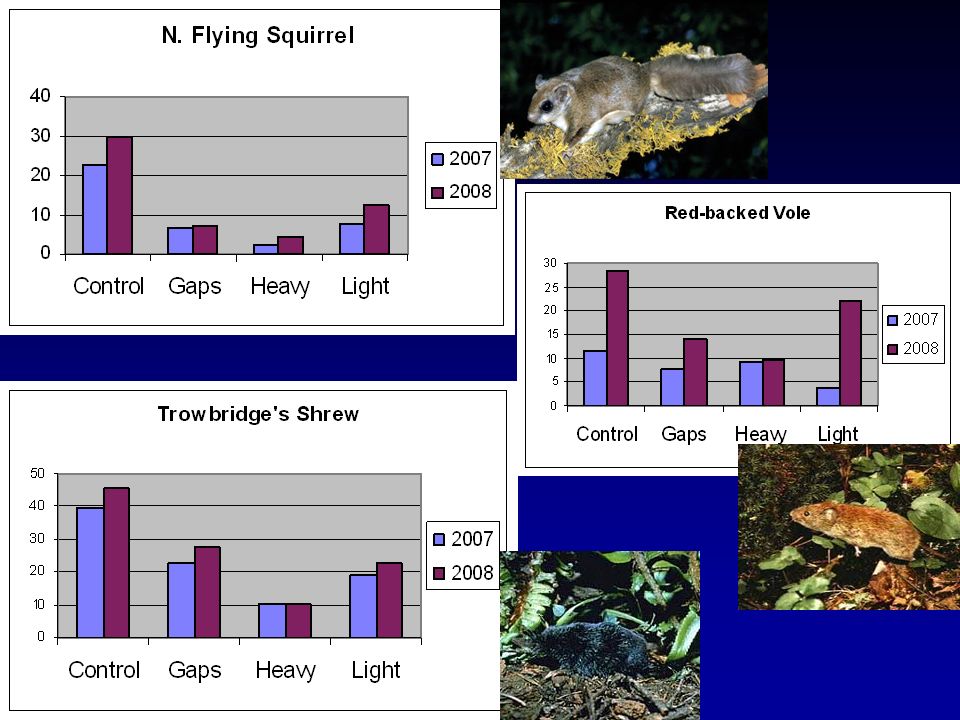
Flying squirrels were more strongly associated with thinning (-) than with dead wood volume (+) Deer mice and creeping voles were more associated with sound dead wood (+) and thinning (+). Townsends chipmunks and California red-backed voles were more associated with dead wood (+) than with thinning (+/-). Associations with Dead Wood Volume
 than with thinning (+/-). Associations with Dead Wood Volume.")
22
CONCLUSIONS Thinning increased CWD volume by 5-10% in some treatments and increased areal cover of dead wood by nearly 20% following thinning. Spatial distribution of wood is highly variable; need 50- 70 plots to characterize means and variances. The sampling CWD transects should be marked permanently to facilitate accurate tallies of CWD pieces in the future.

23
CONCLUSIONS

24
Townsends chipmunk and red-backed vole captures were associated with dead wood. Other species were more associated with thinning or a combination of dead wood and thinning. Change in the understory vegetation was probably more important than dead wood as a determinant of abundance for creeping voles and deer mice. CONCLUSIONS

25
Recommendations Recruited dead wood from thinning is small; larger pre-existing pieces are the most likely to be associated with small mammal abundance. Care around pre-existing pieces is key to maintaining high levels of dead wood in these stands until large trees begin to die (or can be killed) decades into the future.
 decades into the future..")
26
Recommendations Monitoring of dead wood must be intensive, with 50-70 transects per sample area to capture means and variances in stands similar to the ones that we worked in. New techniques should be explored to ensure that pieces measured at one time period can be accurately tracked into the future by different field crews.

27
Recommendations Thinning had a marked and consistent negative effect on northern flying squirrels NOTE: This is consistent with the Forest Ecosystems Studies findings. Since this is a primary food source for northern spotted owls, thinned stands should be strategically placed within a matrix of unthinned stands. We anticipate that flying squirrel populations will recover as the thinned stands close canopy and mature, unthinned stands will be an important bridge until that time.

29
Recommendations Monitoring of small mammals should continue on 10-year intervals to assess when populations of flying squirrels begin recovering in the thinned stands. At the community level, it would be informative to know when, and if, the mammal community in these young stands approximates the community composition and structure in old-growth stands.

30
QUESTIONS?

Similar presentations


 One-sample tests on the mean and variance Professor Ke-Sheng Cheng Department of Bioenvironmental Systems Engineering National.>")


 Stand-level Niches: How Does Everybody Fit In?>")


>")

