Download presentation
Presentation is loading. Please wait.

1
Presentation by Liam Woods Finance Director HSE 18 June 2009

2
Content National financial outlook HSE finances for 2009 Medium term planning focus Sample of change in Mental Health Sample of change in mid West hospitals Conclusion

4
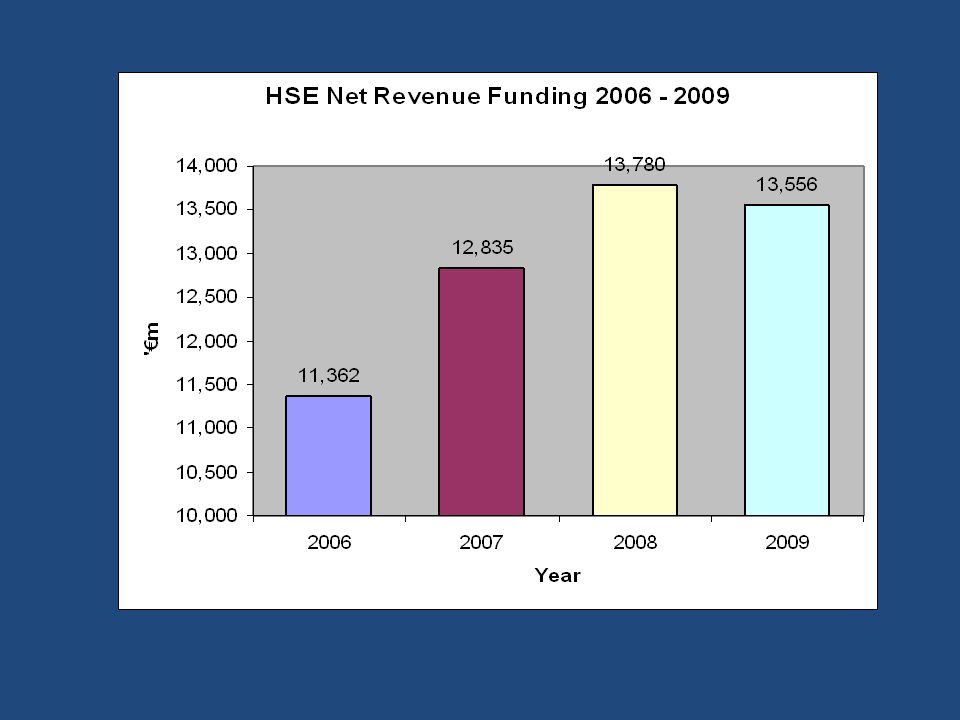
HSE financial trends in brief

9
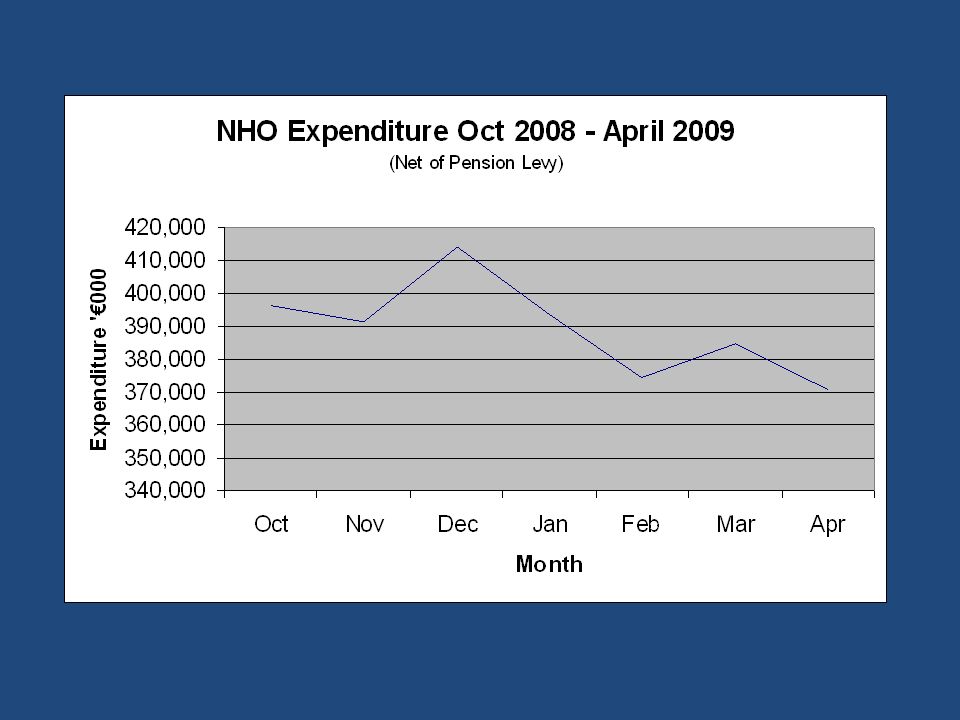
HSE financial challenges in 2009 before the recent budget

11
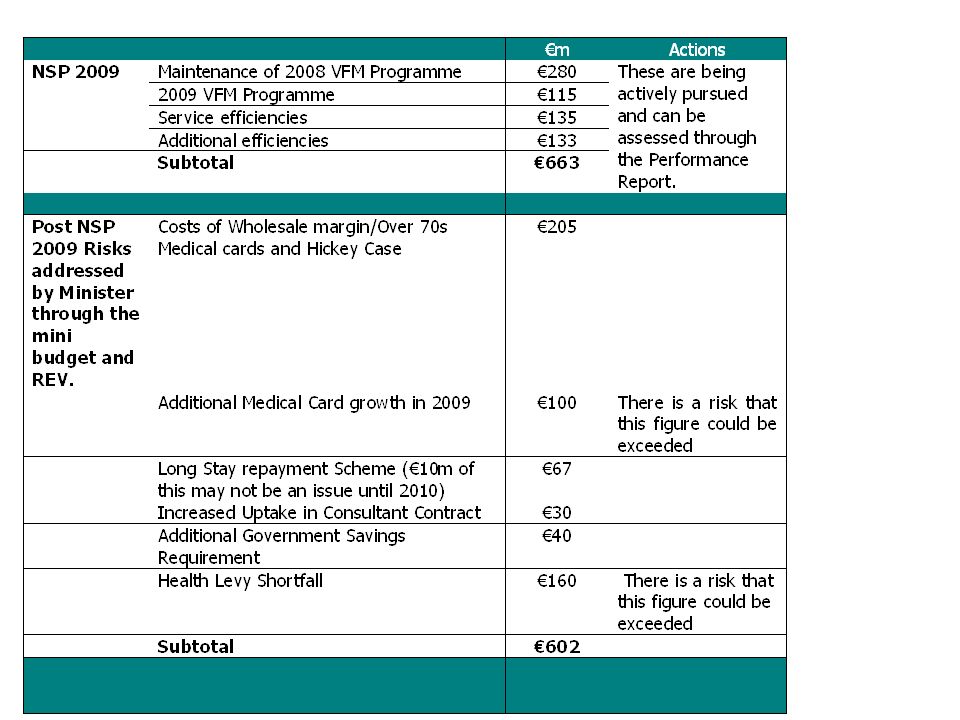
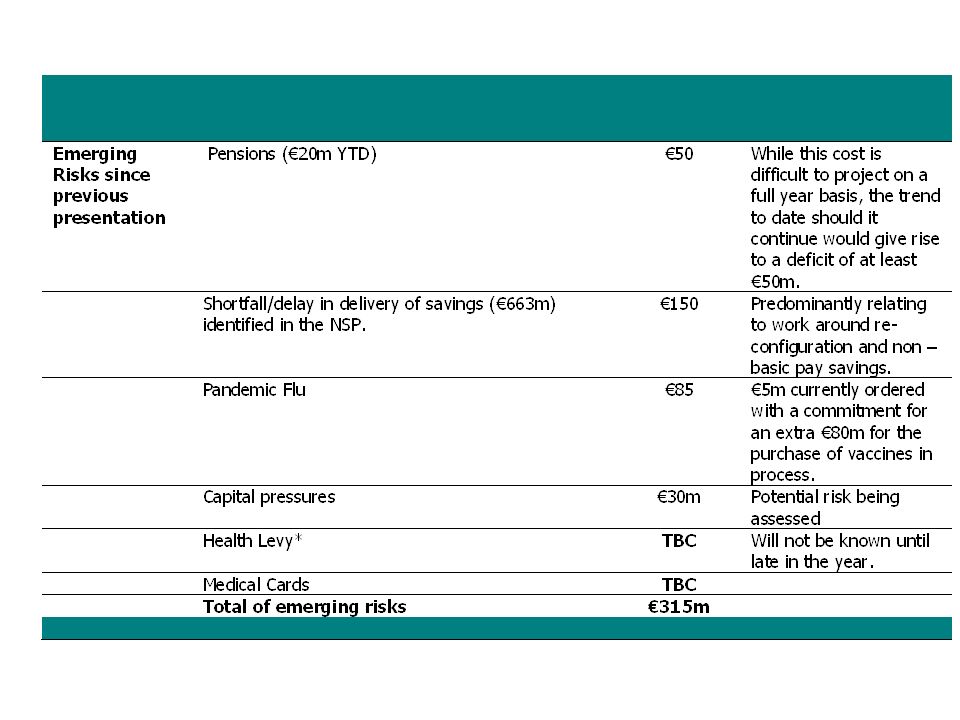
HSE financial challenges in 2009 after the recent budget

13
Focus of medium term planning

14
International Experience Focus on key cost drivers Reconfigure care focusing on ambulatory care Develop clinical leadership Performance manage – use data ICT enable Eliminate services that do not support strategy Shift to geographic management of services

15
Cost Drivers In the USA, 75% of health costs are used to treat people with chronic illness. In Australia, chronic illness account for nearly 70% of allocated health expenditure while in Ontario, the economic burden of chronic disease is estimated at 55% of total direct and indirect health costs. Five illnesses are responsible for most of these costs: Asthma, Congestive Heart Failure, Cardio Vascular Disease, Diabetes and mental illness. Reduction in and control of expenditure in these areas can have a large impact on the overall budgetary position. Health Care Reform Now, A Prescription for Change, George Halvorson, 2007 National Health Priority Action Council (NHPAC), 2006, National Disease Strategy, Australian Government Department of Health and Ageing, Canberra Preventing and Managing Chronic Illness: Ontario’s Framework, Ministry of Health and Long Term Care, May 2007
, 2006, National Disease Strategy, Australian Government Department of Health and Ageing, Canberra Preventing and Managing Chronic Illness: Ontario’s Framework, Ministry of Health and Long Term Care, May")
16
Reconfiguration Reducing inpatient capacity in a planned, swift and sustained manner, substituting in-patient care with ambulatory care in either a hospital or primary care setting. This allows for the delivery of acute services in settings with a critical mass not only improving the cost of services but also the quality of the care provided.

17
Example of change in mental health services through resource reallocation

20
1850 1860 1870 1880 1890 1900 1910 1920 1930 1940 1950 1960 1970 1980 1990 2000 800 700 600 500 400 300 220 100 Number of Mentally Ill Persons Resident in Institutions in Ireland per 100,000 Population from 1850 - 2000 Source: Inspectors Reports / Damien Brennan, 2007

21
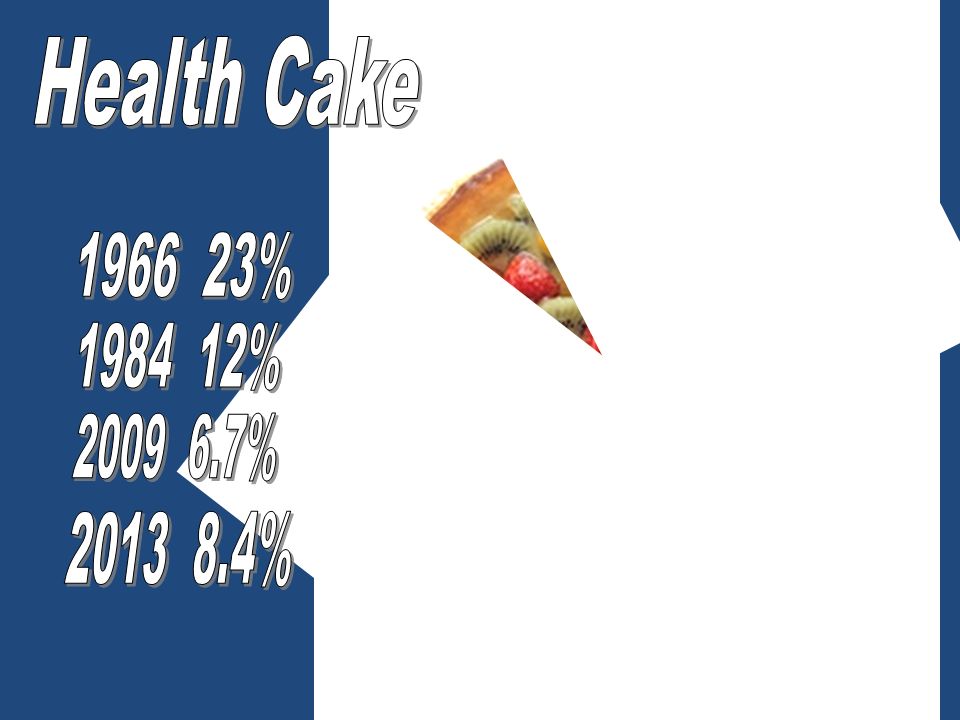
Vision for Change Commitments Revenue Additional Investment of €21.6m annually x 7 years Raising percentage of Health Spending from 6.7% to 8.4% € Human Resource Additional 1,800 WTEs MDT Working New Skills & Investment Capital Sale of Lands & Existing Assets Reinvestment of Proceeds to the value of €796m Organisational Structure Larger Catchments Service User in Management 7

23
Statutory Stat & Vol Stat & Vol with2006Per Capita RegionalNational Local Health Office Expenditu reBudget Patient flowsPopulationAllocations Ranking Rating Mental Health Budget782,763,157754,612,774 796,514,303 4,234,925188 PCCC Dublin/Mid Lein205,943,365178,970,025 206,696,258196,714,8141,215,711 162 4 LHO Area 1 Dublin So51,309,70929,896,000 57,622,23331,737,182126,141 252 2high LHO Area 2 Dublin So17,845,64016,248,730 17,857,029110,186 162 4average LHO Area 3 Dublin So16,056,46114,650,000 16,608,813134,200 124 6low LHO Area 4 Dublin So19,124,78819,044,786 21,202,648147,837 143 5low LHO Area 5 Dublin So13,735,67213,678,214 15,627,715133,562 117 7low LHO Area 9 Kildare/W14,713,06614,565,000 17,529,157203,077 86 9low LHO Area 10 Wicklow11,417,96010,995,298 12,591,074109,328 115 8low LHO Area 11 Laois/Of26,236,13927,579,996 29,588,670137,616 215 3average LHO Area 12 Longford32,409,61131,987,001 33,647,526113,764 296 1high South Western Area R88,303325,000

25
Retirement Window

26
Example of change in Mid West region

27
Services in Mid-West Natural Hub and Spoke ! Populatiion = 360,000 Regional hospital ( Limerick ) St John’s ( Limerick ) Ennis (< 30 mins) Nenagh (< 30 mins) 75% of population live within 25 miles of Limerick
 St John’s ( Limerick ) Ennis (< 30 mins) Nenagh (< 30 mins) 75% of population live within 25 miles of Limerick.")
28
TEAMWORK Background Risk Issues Approx 1 inpatient elective case / day done in 2 local hospitals 105 surgical “emergencies” in one month in Nenagh, only 12 required anaesthetic Jan- July ’08: -- 21 & 28 cases out of hours in St Johns and Ennis (Full theatre on call in 3 local hospitals) 1 in 3 rota (78 rest days) half of all weekends covered by locum! A/E: clinical governance,

29
TEAMWORK Report – Mid West Surgery and Critical Care: “Unable to sustain safe reliable levels of care on a continuous basis in Trauma, Acute Surgery, and ICU/High Dependency” “These issues should be rectified Immediately”.

30
Stakeholder – The Goal! Consultants Patients GP’s Mid West Regional hospital Tertiary Care Centre Major Trauma Unit Academic/University Teaching Centre Centre of Excellence Ennis / Nenagh Local Hospital Advanced diagnostics Day Surgery MIU / MAU / CAAU Inpatient beds Therapies PCT / HSCN

31
Summary First phase of project now complete with out of hours services in Limerick

Similar presentations


 Brussels 17 October 2012 HCN.>")


