Download presentation
Presentation is loading. Please wait.

1
1 Chapter 12: Estimation

2
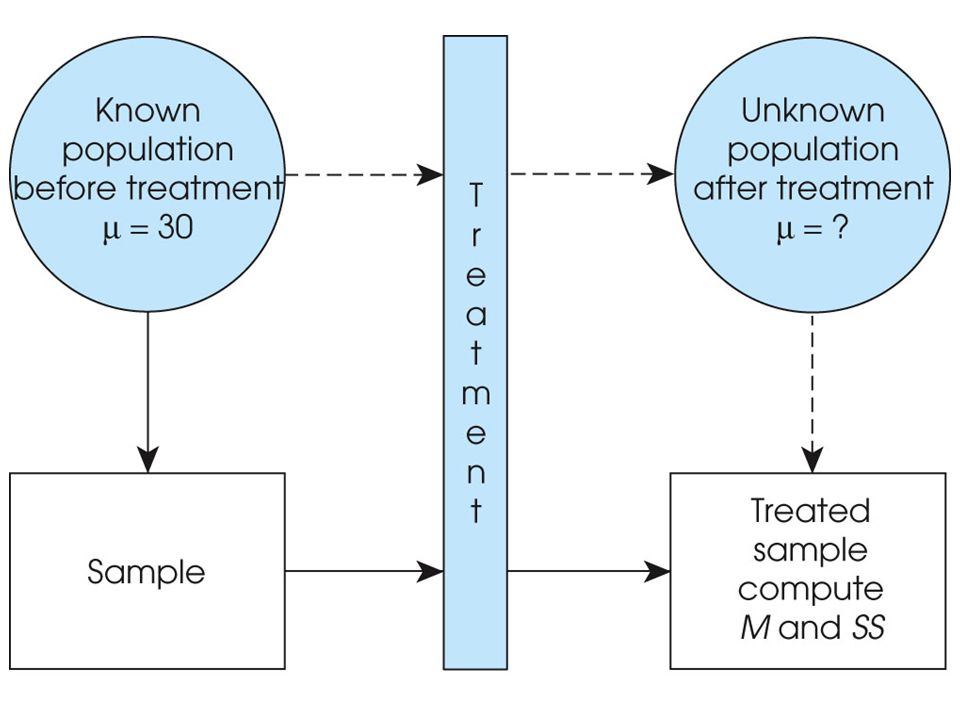
2 Estimation In general terms, estimation uses a sample statistic as the basis for estimating the value of the corresponding population parameter. Although estimation and hypothesis testing are similar in many respects, they are complementary inferential processes. A hypothesis test is used to determine whether or not a treatment has an effect, while estimation is used to determine how much effect.

3
3 Estimation (cont.) This complementary nature is demonstrated when estimation is used after a hypothesis test that resulted in rejecting the null hypothesis. In this situation, the hypothesis test has established that a treatment effect exists and the next logical step is to determine how much effect.

4
4 Estimation (cont.) It is also common to use estimation in situations where a researcher simply wants to learn about an unknown population. In this case, a sample is selected from the population and the sample data are then used to estimate the population parameters.

5
5 Estimation (cont.) You should keep in mind that even though estimation and hypothesis testing are inferential procedures, these two techniques differ in terms of the type of question they address. A hypothesis test, for example, addresses the somewhat academic question concerning the existence of a treatment effect. Estimation, on the other hand, is directed toward the more practical question of how much effect.

8
8 Estimation (cont.) The estimation process can produce either a point estimate or an interval estimate. A point estimate is a single value and has the advantage of being very precise. For example, based on sample data, you might estimate that the mean age for students at the state college is μ = 21.5 years.

9
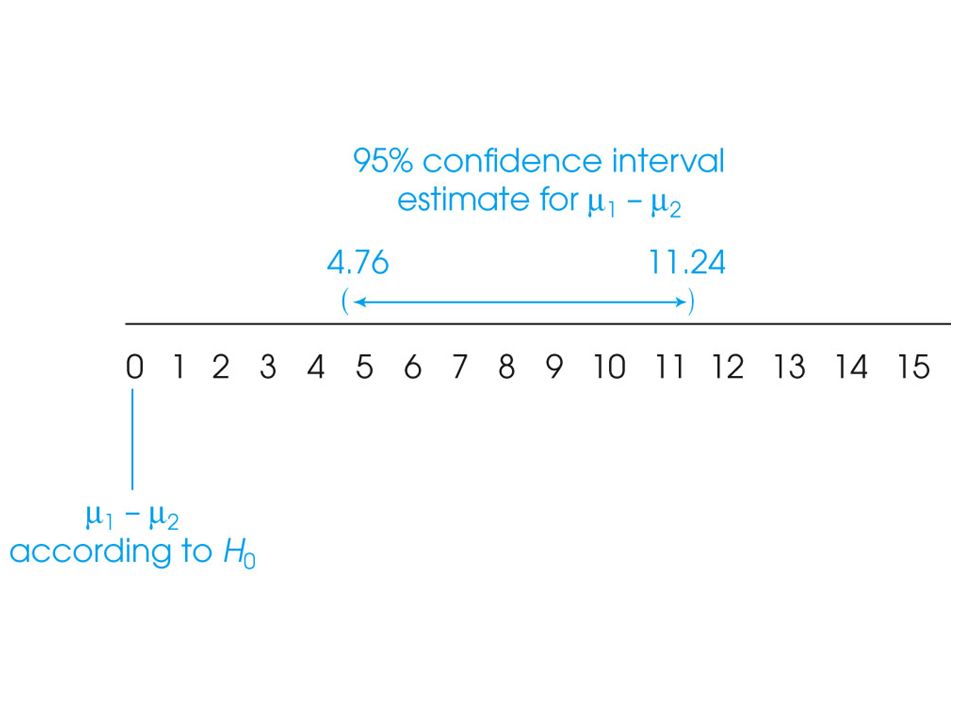
9 Estimation (cont.) An interval estimate consists of a range of values and has the advantage of providing greater confidence than a point estimate. For example, you might estimate that the mean age for students is somewhere between 20 and 23 years. Note that the interval estimate is less precise, but gives more confidence. For this reason, interval estimates are usually called confidence intervals.

10
10 Estimation with the Three t Statistics There is an estimation procedure that accompanies each of the three t tests presented in the preceding three chapters. The estimation process begins with the same t statistic that is used for the corresponding hypothesis test.

11
11 Estimation with the Three t Statistics (cont.) These all have the same conceptual structure: sample statistic - unknown parameter t = ───────────────────────── standard error The basic estimation equation is obtained by solving this equation for the unknown parameter: unknown parameter = statistic ± (t)(standard error)
 These all have the same conceptual structure: sample statistic - unknown parameter t = ───────────────────────── standard error The basic estimation equation is obtained by solving this equation for the unknown parameter: unknown parameter = statistic ± (t)(standard error)")
12
12 Estimation with the Three t Statistics (cont.) For the single sample t, the unknown parameter is the population mean, μ. For the independent-measures t, the parameter is the difference between population means, μ 1 - μ 2, and for the repeated-measures t, the unknown parameter is the population mean difference, μ D. To use the estimation equation, you first must obtain a value for t by estimating the location of the data within the appropriate t distribution.

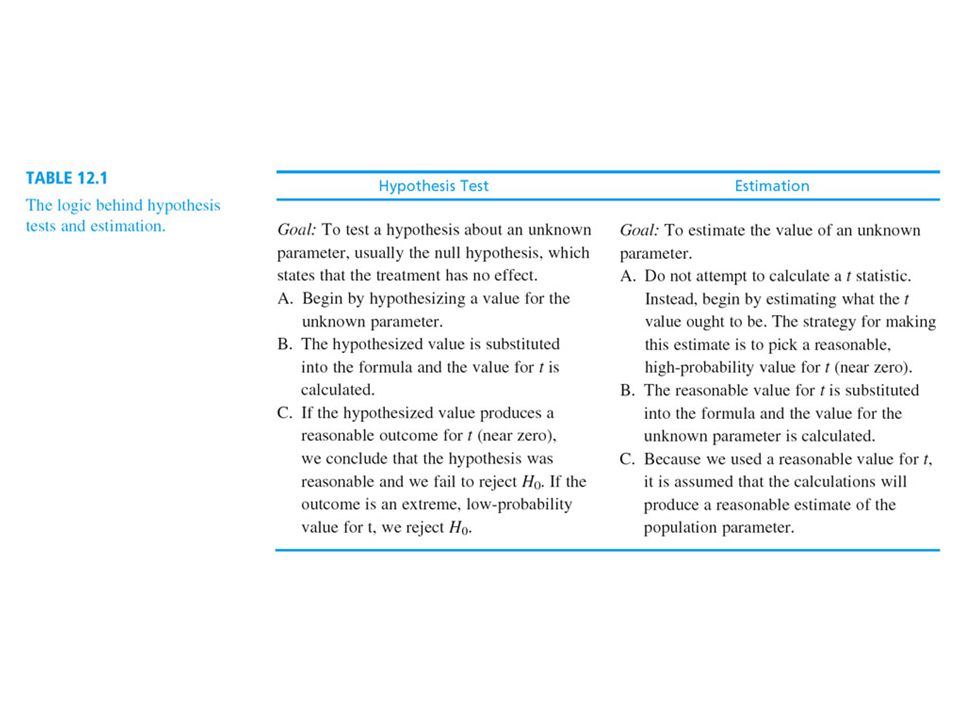
13
13 Estimation with the Three t Statistics (cont.) For a point estimate, a value of zero is used for t, yielding a single value for your estimate of the unknown population parameter. For interval estimates, you first select a level of confidence and then find the corresponding interval range of t values in the t distribution table. The estimated value for t (or range of values) is then substituted in the equation along with the values for the sample statistic and the standard error. The equation is then solved for the unknown parameter.
 is then substituted in the equation along with the values for the sample statistic and the standard error. The equation is then solved for the unknown parameter..")
14
14 Factors Influencing the Width of a Confidence Interval If other factors are held constant, increasing the level of confidence (for example, from 80% to 90%), will cause in increase in the width of the confidence interval. To obtain greater confidence, you must use a wider range of t statistic values, which results in a wider interval.

15
15 Factors Influencing the Width of a Confidence Interval (cont.) On the other hand, increasing the sample size will cause a decrease in the width of the confidence interval. In simple terms, a larger sample gives you more information, which means that you can estimate the population parameter with more precision.

Similar presentations


>")

