Download presentation
Presentation is loading. Please wait.

1
Characterization of Aerosol Physical, Optical and Chemical Properties During the Big Bend Regional Aerosol and Visibility Observational Study (BRAVO) Jenny Hand* Eli Sherman*, Sonia Kreidenweis*, Jeff Collett, Jr.*, Taehyoung Lee*, Derek Day and Bill Malm Colorado State University *Atmospheric Science CIRA/National Park Service Funding by National Park Service
 Jenny Hand* Eli Sherman*, Sonia Kreidenweis*, Jeff Collett, Jr.*, Taehyoung Lee*, Derek Day and Bill Malm Colorado State University *Atmospheric Science CIRA/National Park Service Funding by National Park Service")
2
OUTLINE Motivation for participating in BRAVO Chemical measurements and preliminary results Fine (PM 2.5 ) and Coarse (PM 10 - PM 2.5 ) species Size distribution measurements Experimental set-up and instrument calibration Alignment method: retrieved refractive index and density Comparisons between chemical and physical properties Optical properties: column and point measurements b sp (fine and coarse), aer, Ångstrom exponent Summary
 and Coarse (PM 10 - PM 2.5 ) species Size distribution measurements Experimental set-up and instrument calibration Alignment method: retrieved refractive index and density Comparisons between chemical and physical properties Optical properties: column and point measurements b sp (fine and coarse), aer, Ångstrom exponent Summary")
3
BRAVO STUDY July - October 1999 Big Bend NP has some of the poorest visibility of any monitored Class 1 area in the western U.S. Seasonal trends Sulfates: highest in summer Organic carbon: highest in spring Blowing soil: highest in July (Saharan dust episodes) (Gebhart et al., 2000) Recent work in Grand Canyon NP demonstrated that discrepancies of up to 50% or more exist between measured and reconstructed extinction (Malm and Day, 2000) Particle absorption or coarse scattering?
 (Gebhart et al., 2000) Recent work in Grand Canyon NP demonstrated that discrepancies of up to 50% or more exist between measured and reconstructed extinction (Malm and Day, 2000) Particle absorption or coarse scattering .")
4
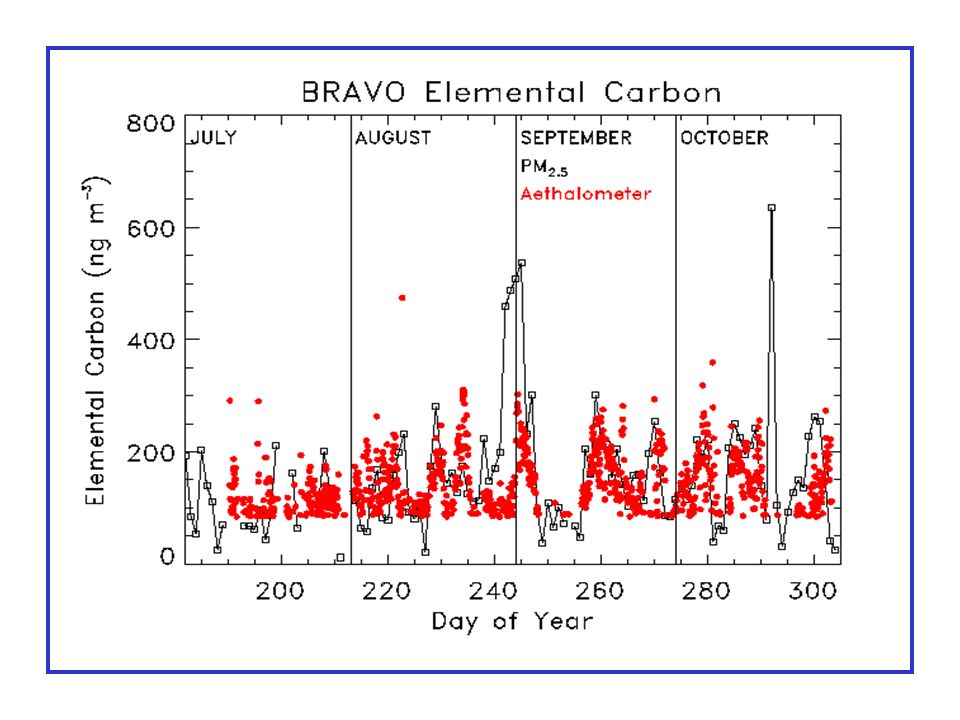
Aerosol Chemistry Measurements PM 2.5 composition CSU: daily samples, on-site analyses of major ionic species and particle acidity IMPROVE: daily samples: major ionic species, plus soil, organic and elemental carbon PM 10 composition IMPROVE: daily samples: major ionic species, plus soil, organic and elemental carbon Coarse composition (PM 10 - PM 2.5 ) Ionic species’ particle size distribution: MOUDI samples Aethalometer- black carbon
 Ionic species’ particle size distribution: MOUDI samples Aethalometer- black carbon")
5
BRAVO PM 2.5 Aerosol Acidity

6
BRAVO Soil Composition

7
Aerosol Size Distribution Measurements Dry size distributions were measured continuously ranging from 0.05< D p < 20 µm Instruments: TSI Differential Mobility Analyzer (DMA): 0.05 < D p < 0.87 µm (21 bins) PMS Optical Particle Counter (OPC): 0.1 < D p < 2 µm (8 bins) TSI Aerodynamic Particle Sizer 3320 (APS): 0.5 < D p < 20 µm (51 bins) Pre-, during-, and post-study calibration were performed using PSL, ammonium sulfate and oleic acid.
: 0.05 < D p < 0.87 µm (21 bins) PMS Optical Particle Counter (OPC): 0.1 < D p < 2 µm (8 bins) TSI Aerodynamic Particle Sizer 3320 (APS): 0.5 < D p < 20 µm (51 bins) Pre-, during-, and post-study calibration were performed using PSL, ammonium sulfate and oleic acid.")
8
Instrument Calibration Empirical equations determined from instrument calibration relate real refractive index to OPC channel diameter (D opt D p ) Channel collection efficiencies were determined Effective density ( e ) was related to APS channel diameter (D ae D p ) by the following equation: where
 Channel collection efficiencies were determined Effective density ( e ) was related to APS channel diameter (D ae D p ) by the following equation: where")
9
Examples of Aligned and Unaligned DMA and OPC Volume Distributions Unaligned Aligned

10
Example of Combined Volume Distribution BRAVO 991008

11
BRAVO Volume Distributions

12
Comparisons between chemical and physical properties Refractive index and density: retrieved from alignment method and calculated from chemical composition Total (PM 10 ) reconstructed mass and M = V tot from size distributions, assuming X=1.2 MOUDI mass size distributions and volume distributions EC and aethalometer measurements
 reconstructed mass and M = V tot from size distributions, assuming X=1.2 MOUDI mass size distributions and volume distributions EC and aethalometer measurements")
13
Accumulation Mode Parameters D gv gg

14
Coarse Mode Parameters D gv gg

15
Refractive Index and Density Real refractive index and effective density were retrieved from size distribution alignment method Values based on chemistry were calculated using a volume weighted method: and Species included: (NH 4 ) 2 SO 4 : m = 1.53, = 1.76 g cm -3 OC: m = 1.55, = 1.4 g cm -3 EC: m = 1.96 - 0.66i, = 2.0 g cm -3 NH 4 NO 3 : m = 1.554, = 1.725 g cm -3 Soil: SiO 2, Al 2 O 3, Fe 2 O 3, CaO, TiO 2 (IMPROVE)
 2 SO 4 : m = 1.53, = 1.76 g cm -3 OC: m = 1.55, = 1.4 g cm -3 EC: m = i, = 2.0 g cm -3 NH 4 NO 3 : m = 1.554, = g cm -3 Soil: SiO 2, Al 2 O 3, Fe 2 O 3, CaO, TiO 2 (IMPROVE)")
16
Aerosol Refractive Index and Density

17
Total Mass Comparisons PM 10 total mass concentration M = V tot, assuming X = 1.2

18
MOUDI Mass and Volume Distributions

20
Calculations of Light Scattering Coefficient (b sp ) b sp was calculated using combined volume distributions and converged values of refractive index Q sp is the Mie scattering efficiency assuming spherical particles. b sp was calculated for the accumulation and coarse particle modes

21
BRAVO scattering distribution

22
Comparisons of NPS and CSU Dry b sp

23
Dry Mass Scattering Efficiency Accumulation ModeCoarse Mode

24
Calculation of Aerosol Optical Depth ( aer ) USDA UV-B radiation monitoring program has a fully instrumented site approximately 30 miles from BRAVO site in Big Bend National Park YES visible Multi-Filter Rotating Shadowband Radiometer measures irradiance with seven wavelength channels: 415, 500, 610, 665, 860, and 940 nm (Bigelow et al., 1998) Rayleigh and ozone optical depths were removed from column measurements of total optical depth Clouds and high sun angle measurements were removed Point measurements of aer were determined by assuming a well-mixed layer and estimates of boundary layer heights
 USDA UV-B radiation monitoring program has a fully instrumented site approximately 30 miles from BRAVO site in Big Bend National Park YES visible Multi-Filter Rotating Shadowband Radiometer measures irradiance with seven wavelength channels: 415, 500, 610, 665, 860, and 940 nm (Bigelow et al., 1998) Rayleigh and ozone optical depths were removed from column measurements of total optical depth Clouds and high sun angle measurements were removed Point measurements of aer were determined by assuming a well-mixed layer and estimates of boundary layer heights")
25
Two days were chosen for comparison:

26
Aerosol Optical Depth at 500 nm August 15, 1999 October 12, 1999

27
Ångstrom Wavelength Exponent ( ) Calculated for both point and column measurements over the wavelength range from 415 nm - 860 nm (Eck et al., 1999 & Reid et al., 1999) Two days were chosen for comparison, demonstrating very different aerosol physical, chemical and optical properties Column:Point:
 Calculated for both point and column measurements over the wavelength range from 415 nm nm (Eck et al., 1999 & Reid et al., 1999) Two days were chosen for comparison, demonstrating very different aerosol physical, chemical and optical properties Column:Point:")
28
Ångstrom wavelength exponent (415 - 860 nm) August 15, 1999October 12, 1999
 August 15, 1999October 12, 1999")
29
Correlations between b sp and aer were found for several days:

30
Correlations between b ext and aer were found for all months:

31
Correlations between CSU and UVB were found for all months:

32
Summary Sulfate was typically the major chemical species in the fine mode, although soil and OC were important during certain events Size distributions suggested that high coarse mode volume contributed significantly to total volume, especially during suspected Saharan dust events A new alignment method allowed for retrieving refractive index and effective density, in agreement with calculated values Calculated light scattering coefficients agreed well with measured values, and demonstrated periods when coarse scattering was important, often during suspected Saharan dust events

33
Summary, continued Time resolved sulfate measurements were observed to trend with light scattering coefficients, suggesting sulfate was the major contributor to visibility degradation during the study MOUDI mass distributions compared well with measured volume distributions Column and point measurements of aerosol optical depth were observed to be correlated for several days investigated Angstrom wavelength exponents agreed well between the two methods, and reflected the different aerosol types observed

Similar presentations


 1990 Visibility: Existing and Historical.>")


 NASA Goddard Space Flight Center.>")