Download presentation
Presentation is loading. Please wait.

1
Construction And Analysis of Hydrographs ©Microsoft Word clipart

2
Hydrograph Record of River Discharge over a period of time River Discharge = cross sectional area rivers mean (average) velocity X (at a particular point in its course) Storm Hydrographs Show the change in discharge caused by a period of rainfall
 velocity X (at a particular point in its course) Storm Hydrographs Show the change in discharge caused by a period of rainfall")
3
Why Construct & Analyse Hydrographs ? To find out discharge patterns of a particular drainage basin Help predict flooding events, therefore influence implementation of flood prevention measures ©Microsoft Word clipart

4
Construction Of Storm (flood) Hydrographs ©Microsoft Word clipart
 Hydrographs ©Microsoft Word clipart")
5
0 12 24 36 48 30 72 Hours from start of rain storm 3 2 1 Discharge (m 3 /s) Base flow Through flow Overland flow Rising limb Recession limb Basin lag time mm 4 3 2 Peak flow Flood Hydrograph
 Base flow Through flow Overland flow Rising limb Recession limb Basin lag time mm Peak flow Flood Hydrograph")
6
0 12 24 36 48 30 72 Hours from start of rain storm 3 2 1 Discharge (m 3 /s)
")
7
0 12 24 36 48 30 72 Hours from start of rain storm 3 2 1 Discharge (m 3 /s) mm 4 3 2 Rainfall shown in mm, as a bar graph
 mm Rainfall shown in mm, as a bar graph")
8
0 12 24 36 48 30 72 Hours from start of rain storm 3 2 1 Discharge (m 3 /s) mm 4 3 2 Discharge in m 3 /s, as a line graph
 mm Discharge in m 3 /s, as a line graph")
9
0 12 24 36 48 30 72 Hours from start of rain storm 3 2 1 Discharge (m 3 /s) Rising limb mm 4 3 2 Rising limb The rising flood water in the river
 Rising limb mm Rising limb The rising flood water in the river")
10
0 12 24 36 48 30 72 Hours from start of rain storm 3 2 1 Discharge (m 3 /s) Rising limb mm 4 3 2 Peak flow Maximum discharge in the river
 Rising limb mm Peak flow Maximum discharge in the river")
11
0 12 24 36 48 30 72 Hours from start of rain storm 3 2 1 Discharge (m 3 /s) Rising limb Recession limb mm 4 3 2 Peak flow Recession limb Falling flood water in the river
 Rising limb Recession limb mm Peak flow Recession limb Falling flood water in the river")
12
0 12 24 36 48 30 72 Hours from start of rain storm 3 2 1 Discharge (m 3 /s) Rising limb Recession limb Basin lag time mm 4 3 2 Peak flow Basin lag time Time difference between the peak of the rain storm and the peak flow of the river
 Rising limb Recession limb Basin lag time mm Peak flow Basin lag time Time difference between the peak of the rain storm and the peak flow of the river")
13
0 12 24 36 48 30 72 Hours from start of rain storm 3 2 1 Discharge (m 3 /s) Base flow Rising limb Recession limb Basin lag time mm 4 3 2 Peak flow Base flow Normal discharge of the river
 Base flow Rising limb Recession limb Basin lag time mm Peak flow Base flow Normal discharge of the river")
14
0 12 24 36 48 30 72 Hours from start of rain storm 3 2 1 Discharge (m 3 /s) Base flow Through flow Overland flow Rising limb Recession limb Basin lag time mm 4 3 2 Peak flow Overland flow Through flow + = Storm Flow
 Base flow Through flow Overland flow Rising limb Recession limb Basin lag time mm Peak flow Overland flow Through flow + = Storm Flow")
15
Volume of water reaching the river from surface run off Overland flowThrough flow Volume of water reaching the river through the soil and underlying rock layers

16
Analysis ©Microsoft Word clipart

17
Factors influencing Storm Hydrographs Area Shape Slope Rock Type Soil Land Use Drainage Density Precipitation / Temp Tidal Conditions ©Microsoft Word clipart

18
Interpretation of Storm Hydrographs Rainfall Intensity Rising Limb Recession Limb Lag time Peak flow compared to Base flow Recovery rate, back to Base flow You need to refer to: Basin lag time 0 12 24 36 48 30 72 Hours from start of rain storm 3 2 1 Discharge (m 3 /s) Base flow Through flow Overland flow Rising limb Recession limb mm 4 3 2 Peak flow
 Base flow Through flow Overland flow Rising limb Recession limb mm Peak flow")
19
When interpreting hydrographs all factors must be considered together ! Here are some theoretical interpretations of influencing factors BUT…… ©Microsoft Word clipart

20
Area Large basins receive more precipitation than small therefore have larger runoff Larger size means longer lag time as water has a longer distance to travel to reach the trunk river AreaRock TypeDrainage Density ShapeSoilPrecipitation / Temp SlopeLand UseTidal Conditions

21
Shape Elongated basin will produce a lower peak flow and longer lag time than a circular one of the same size AreaRock TypeDrainage Density ShapeSoilPrecipitation / Temp SlopeLand UseTidal Conditions

22
Slope Channel flow can be faster down a steep slope therefore steeper rising limb and shorter lag time AreaRock TypeDrainage Density ShapeSoilPrecipitation / Temp SlopeLand UseTidal Conditions

23
Rock Type Permeable rocks mean rapid infiltration and little overland flow therefore shallow rising limb AreaRock TypeDrainage Density ShapeSoilPrecipitation / Temp SlopeLand UseTidal Conditions

24
Soil Infiltration is generally greater on thick soil, although less porous soils eg. clay act as impermeable layers The more infiltration occurs the longer the lag time and shallower the rising limb AreaRock TypeDrainage Density ShapeSoilPrecipitation / Temp SlopeLand UseTidal Conditions

25
Land Use Urbanisation - concrete and tarmac form impermeable surfaces, creating a steep rising limb and shortening the time lag Afforestation - intercepts the precipitation, creating a shallow rising limb and lengthening the time lag AreaRock TypeDrainage Density ShapeSoilPrecipitation / Temp SlopeLand UseTidal Conditions

26
Drainage Density A higher density will allow rapid overland flow AreaRock TypeDrainage Density ShapeSoilPrecipitation / Temp SlopeLand UseTidal Conditions

27
Precipitation & Temperature Short intense rainstorms can produce rapid overland flow and steep rising limb If there have been extreme temperatures, the ground can be hard (either baked or frozen) causing rapid surface run off Snow on the ground can act as a store producing a long lag time and shallow rising limb. Once a thaw sets in the rising limb will become steep AreaRock TypeDrainage Density ShapeSoilPrecipitation / Temp SlopeLand UseTidal Conditions

28
Tidal Conditions High spring tides can block the normal exit for the water, therefore extending the length of time the river basin takes to return to base flow AreaRock TypeDrainage Density ShapeSoilPrecipitation / Temp SlopeLand UseTidal Conditions

29
Remember! These influencing factors will: Influence each other Change throughout the rivers course ©Microsoft Word clipart

30
A number of factors (known as drainage basin controls) influence the way in which a river responds to precipitation and have an effect on the shape of the hydrograph. The size, shape and relief of the basin are important controls. Water takes longer to reach the trunk stream in a large, round basin than in does in a small, narrow one.

31
Where gradients are steep, water runs off faster, reaches the river more quickly and causes a steep rising limb. Prolonged heavy rain causes more overland flow than light drizzly rain.

32
Areas of permeable rocks and soil allow more infiltration and so less surface run off.

33
The way in which the land is used will also have an influence on the hydrograph – vegetation intercepts precipitation and allows evaporation to take place directly into the atmosphere so reducing the amount of water available for overland flow while the large number of impermeable surfaces in urban areas encourages run off into gutters and drains carrying water quickly to the nearest river

34
Hydrograph Model Answer

36
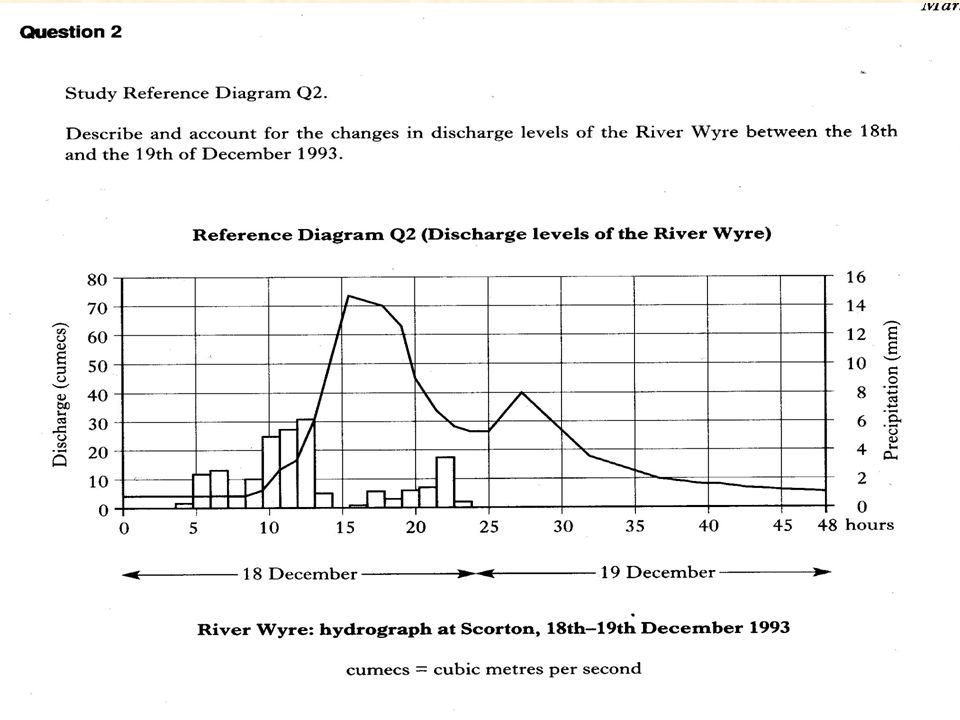
The discharge levels of the River Wyre changed dramatically between the 18th and 19th of December. This is clearly the result of heavy rainfall affecting the region during that time. Before the first fall of rain, the discharge levels remained quite low and steady, at approximately 4 cumecs, and remained like this for at least 9 hours, some 4 hours after the first fall of rain. Continued heavy rainfall has created a steep rising limb on the hydrograph which reaches a peak at about 74 cumecs. The river continues to flow at a high level for several hours more before falling steeply. A later period of rainfall, although not as heavy as the previous spell, during the evening of the 18th explains the secondary peak in discharge, this time reaching approximately 40 cumecs in the early hours of the 19th. It stopped raining around midnight on the 18th/19th. This is reflected in the gradual lowering of water levels which eventually even off and almost return to the level they were at before the rain started.

37
The reason for the differences between peak rainfall and peak discharge, may be due to a number of different factors and processes. The lag time works out at approximately 4 hours, which means that it has taken at least 4 hours from the time that it started raining for the rainwater to reach the River Wyre. When precipitation reaches the ground, it can be affected by several processes which take differing amounts of time. The precipitation may be infiltrated into the soil layer before eventually reaching the river channel, this is a slow process that could account for the time difference. As well as this the precipitation may have become intercepted by vegetation. The area around the River Wyre may be well vegetated and therefore much of the rainwater has been either intercepted or has been affected by stemflow.

38
Also geological factors such as rock type may have played a role. If the rocks surrounding the river Wyre are impermeable, the water might percolate through the cracks in the rocks, or it may become part of the groundwater. Relief is another important factor, if the land is very steep, then the precipitation should reach the river channel quicker than if the land was very flat. I would suggest that the surrounding land of the River Wyre is reasonably flat, and therefore this has affected the time taken for the rainwater to reach the river channel. All of these factors are accountable for explaining the difference in peak rainfall and peak discharge in the River Wyre during the 18th and 19th of December.

Similar presentations


The following points should be mentioned in your answers; –Water flows through the system.>")
 GCSE Geography Theme 2 Topic 2 Click to continue Hodder Education Revision Lessons Understanding hydrographs.>")


