Download presentation
Presentation is loading. Please wait.

1
Economics of Small Business Fourth Week

2
Is Small Business the Engine of Job Creation?

3
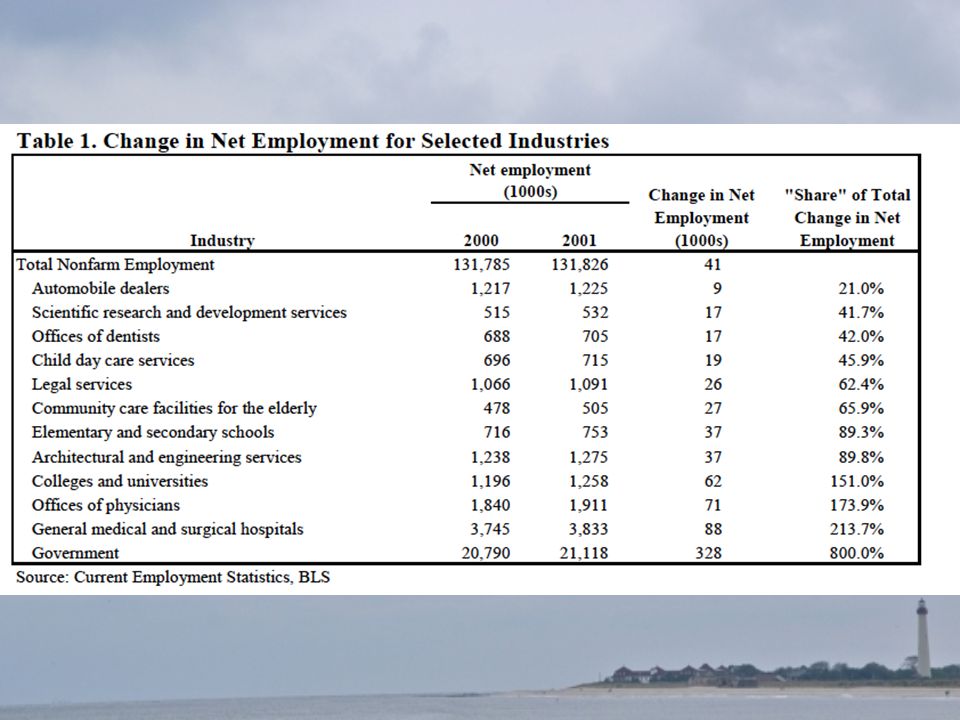
From Bloomberg Businessweek, Feb, 10, 2014

4
Are Small Businesses The Engine Of Growth? “ … it is not small businesses per se that are important, but flexible, innovative, risk- taking businesses, which tend to be small.” “As such, the concept of “small business” as an analytical category seems rather useless.”

5
Source The quotes are from a paper by Veronique de Rugy, published by the American Enterprise Institute, AEI There is a political angle. AEI is opposed to all government intervention in the economy – including policies that support small business.

6
Public Programs De Rugy begins with an inventory of public programs that support small business. Save it. We will come back to that! She puts the overall bill at over 14 billion. That is probably an underestimate, but a more careful estimate would also look at the benefits – other than growth.

7
Gross versus Net 1 It could be that SMEs (or some other size category) open many new jobs, but also eliminate many jobs through dismissals and discontinuations of the business. Then they would create many jobs on a gross basis, but many fewer, perhaps a negative number on a net basis. Therefore, economists tend to emphasize net job creation. De Rugy argues that this creates a bias in favor of SMEs.

8
Example In this example, all net new jobs are created by the one small business, but 80% gross are created by big business.

9
Second Thoughts? Is this persuasive? After all, in year 2 the additional 50 people who are employed are employed by the small business! The proportion of people employed in small business has increased from 20% to 22.5%. Here is perhaps a better example to get the point:

10
Another Example The point is, big firms, growing and declining at the same rate, create – and destroy – more jobs.

11
Proportion In the second example, the proportion of employees who work for the small business grows from 9% to 11%. If it is true that small businesses lead in net job creation, then we should see an increase in the proportion of employees who are employed by small business. Do we? De Rugy says no.

13
Denominator Clearly de Rugy has a point – net job creation statistics can be misleading. (So can gross job creation statistics, for other reasons.) The problem seems to be that the denominator is NOT the sum of the numerator numbers but something more complicated.
 The problem seems to be that the denominator is NOT the sum of the numerator numbers but something more complicated..")
14
Balancing “Judging the role of small businesses in job creation based on their large share of net job growth is therefore very misleading because firms of all sizes contribute large numbers of new jobs.” “ … small employers both create and destroy jobs at much higher rates than large employers. Consequently, net job creation exhibits no strong relationship to employer size.”

15
Part of a Table As we see, SMEs both create and destroy jobs at a higher rate.

16
Gross versus Net 2 Both approaches have advantages and disadvantages. –Gross job creation simply ignores the fact that a sector with larger turnover (such as SMEs) will both create and destroy more jobs. –Net, as we have seen, can distort the picture as the numbers do not add up in straightforward ways.
 will both create and destroy more jobs. –Net, as we have seen, can distort the picture as the numbers do not add up in straightforward ways..")
17
Regression Fallacy 1 Suppose some firms are below their “normal size” (based on economies of scale, etc) in period 1. Others are above. Those below their “normal size” will be smaller on the average, than those that are above. Moving toward the normal size, the first group grow and the last group shrink. Looking at that, we might conclude – wrongly! -- that smaller firms grow faster on the average.

18
Regression Fallacy The fallacy is that if companies tend to approach a “natural” size, on the whole, the companies that grow will be the ones below the natural size. They don’t grow because they are small but because they are recovering. Here is a numerical example to illustrate the problem.

19
Three Firms 1 Yearfirm 1firm2firm3 Average firm size 0100 175100125100 287.5100112.5100 393.75100106.25100 496.875100103.125100 598.4375100101.5625100 699.21875100100.78125100 799.609375100100.390625100 899.8046875100100.1953125100 999.90234375100100.0976563100 1099.95117188100100.0488281100

20
Three Firms 2 In year zero, each firm is at its “natural” scale. In year 1, shocks shift firms 1 and 3 away from the “natural” scale. In later years, each firm makes up half the difference of “natural” scale and the scale last year.

21
Firm Size and Growth Scale in Year 1Rate of Growth 750.166666667 1000 125-0.1 Firm Growth from Year 1 to Year 2

22
Reflections Thus we see an apparent negative relation between firm size and firm growth. Nevertheless, they are converging to the same “natural” size. Moreover, the average firm size remains constant at 100.

23
Reflections The regression fallacy is particularly important and probably explains why we see a relatively stable proportion of employees employed in small firms at the same time we observe smaller firms opening new jobs at a higher rate on the average.

24
Interim Summary Analysis of the statistical measures used leads to reasonable doubts about claims that “small businesses create most jobs.” The regression fallacy could also make it seem that smaller firms create more jobs, when actually it is firms that are just catching up, regardless of their stable size.

25
High Impact Firms A study sponsored by the SBA concluded that: “ … a relatively small class of firms was responsible for generating nearly all net new jobs in the U.S. economy from 1994 to 2006.” “ …high impact companies are enterprises whose sales have at least doubled over a four-year period and which have an employment growth quantifier of two or more over the same period.”

26
Sketch 1 “ …there were about 350,000 high impact companies in the U.S. economy.” “This represents about 6.3 percent of all companies in the economy.” “These companies are younger and more productive than all other firms and are found in relatively equal shares across all industries, even declining and stagnant ones.”

27
Sketch 2

28
Reflections VSEs – the 1-19 category – are about 89% of all firms, so they are slightly over- represented. However, the biggest category are about 0.2% of all firms – they are clearly overrepresented.

29
Biases This study does not correct for the regression fallacy. Thus it will generally underestimate the size of high-impact firms. (As we will see, though, there is a bias that might be in the opposite direction.) There are no start-ups in the data set. Therefore it may overestimate the age of high-impact firms.
 There are no start-ups in the data set. Therefore it may overestimate the age of high-impact firms..")
30
Employment Quantifier The “employment quantifier” is the product of the absolute and percent increase in employment. This is supposed to be a compromise, on the grounds that –Absolute values favor bigger firms –Percent value favor smaller firms

31
Boundary Increase in Absolute Employment

32
Boundary Percent Increase in Employment

33
Contrast In summary we see that to count as a high-impact firm –A 5-employee firm would have to increase its employment by 60% –A 1000-employee firm by 4.5% But –The 60% of 5 is 3 new jobs –The 4.5% of 1000 is 45 new jobs. Which way does the bias go?

34
Sales Since the company must also double its sales, these limits probably affect relatively few companies – and only those that increase their productivity or price at high rates relative to their work force. By contrast “gazelles” are defined only by increasing sales, but must increase sales steadily at 20% per year or more (I think).
..")
36
Trend? We do seem to see some downward trend, except in the VSE size category 1-19. Given that we have just four observations we should treat this with some caution.

37
Net Job Creation By various computations it is argued that these companies create 100% or more of net new jobs. This should not be a surprise! What it means is that the criteria are successful in capturing the high-impact companies as intended! But what is remarkable is how little they differ from other companies.

38
Little Difference For example, they are equally likely to be in declining industries! There is no evident pattern in the distribution across industries. Nor from one region to another. They are slightly more likely to be in urban areas.

39
But Some Key Differences 1 They are somewhat younger. This may be understated, since start-ups cannot be included in this study. However, average ages of HICs is never less than 15 years and increases with the size category.

40
But Some Key Differences 2 They are more productive. On the average, productivity increases with firm size. Within a firm size category, HICs are almost always more productive. Exceptions: agriculture, forestry, restaurants, finance.

41
Productivity Differences? 1 These are average revenue productivity comparisons, so they reflect price differences as well as physical productivity differences. In pure theory, physical productivity differences should be very limited, since all have access to the same technology.

42
Productivity Differences? 2 In fact, we have known since the 1960s that physical productivity can vary by as much as 50% among comparable firms in the same industry. Harvey Leibenstein, who made this known, called it X-efficiency – x for the unknown.

43
Productivity Differences? 3 Robert Lucas (who later received the Nobel prize for his work in macroeconomics) attributed this to innate differences in talent for management. Those least talented would choose to be workers rather than businessmen. There could still be a considerable range of different talents among active businessmen.
 attributed this to innate differences in talent for management. Those least talented would choose to be workers rather than businessmen. There could still be a considerable range of different talents among active businessmen..")
44
Productivity: Cause or Effect? Do these companies grow rapidly just because they are more productive? Greater productivity will certainly make growth an easier choice! –Profits can be reinvested –The productive firm can underprice its competition and still be profitable. But we would like to know what underlies both growth and productivity!

45
Barriers to Raising Capital The study explores one other characteristic of some firms: difficulty raising capital. Result: HICs are no more likely to have this difficulty than other firms in the same size category. However, smaller firms are more likely to face this difficulty.

47
Conclusions 1 HICs are a small but significant minority of firms at all size categories. Thus, policies to support small businesses are not a very effective way to encourage growth. –Most costs will go to support firms that do not grow – most do not, in all size categories. –However, the same criticism can be applied to de Rugy’s “conservative” alternative, tax cuts.

48
Conclusions 2 Nevertheless, there is a large absolute number of HICs in the smallest category, VSEs, and in SMEs generally. Can we support them selectively? If anybody could “pick the winners” then they probably would already be winners, without need for support. Selective growth policies will have to rely on pretty complex rules, at best.

Similar presentations


 Lecturer, University of Athens, Dpt. of Economics & Senior R&D Dpt.>")


