Download presentation
Presentation is loading. Please wait.

1
Presented to School Districts in Arkansas

4
Is educational equity really an issue? Nationally – Black children represent 18% of preschool enrollment, but 48% of preschool children who receive more than one out of school suspension – Annually about 5% of white students are suspended or expelled and 16% of black students. – Black students are 2.5 times more likely to be identified as a student with intellectual disability as any other student group.

5
Is educational equity really an issue? In Arkansas – Annually, 7.5% of white students receive out of school suspensions of any length and 20.9% of black students receive out of school suspensions of any length – In one school district in Arkansas, Black students have been up to nine times as likely to be identified as a student with an intellectual disability as any other race/ethnicity. (has reduced over time to 8 and then 5 times as likely).
..")
10
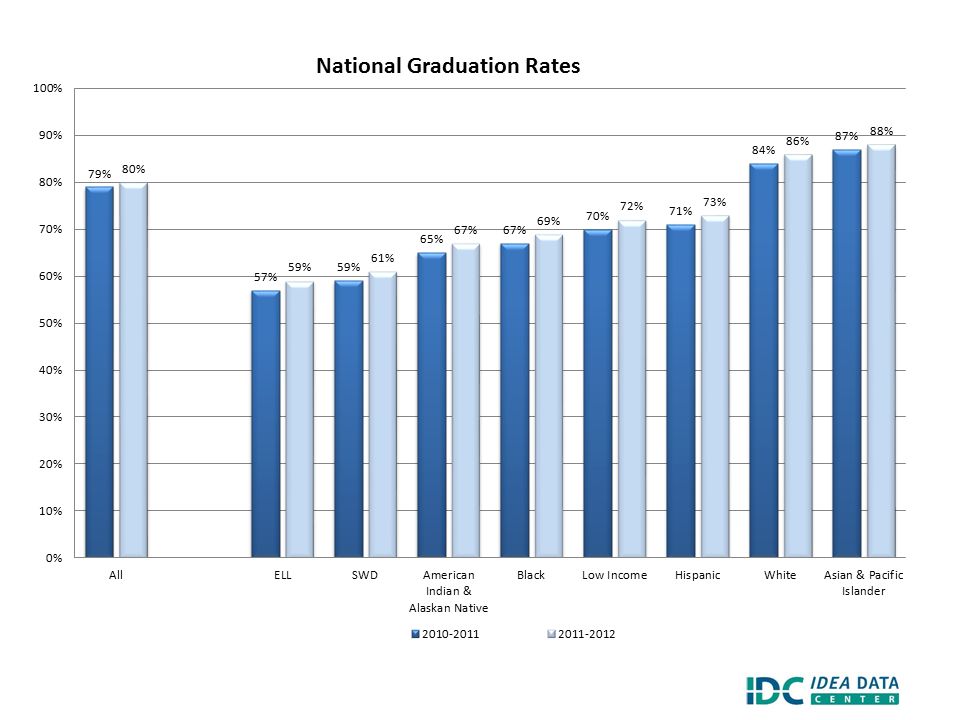
The Graduation Gap: What the Data Tell Us: All States, % of SWDs Graduating With Regular Diploma, 2010-11 SOURCE: U.S. Department of Education, Office of Special Education Programs, Data Analysis System (DANS), OMB #1820-0043: "Children with Disabilities Receiving Special Education Under Part B of the Individuals with Disabilities Education Act," 2010-11.
, OMB # : Children with Disabilities Receiving Special Education Under Part B of the Individuals with Disabilities Education Act,")
14
SOURCE: U.S. Department of Education, Office for Civil Rights, Civil Rights Data Collection, 2011-12.

15
Do Black Students Misbehave More? Of 32 infractions, only 8 significant differences: White students referred more for: Smoking Vandalism Leaving w/o permission Obscene Language Black students referred more for: Disrespect Excessive Noise Threat Loitering Skiba, R.J., Michael, R.S., Nardo, A.C. & Peterson, R. (2002). The color of discipline: Sources of racial and gender disproportionality in school punishment. Urban Review, 34, 317-342.
. The color of discipline: Sources of racial and gender disproportionality in school punishment. Urban Review, 34,")
16
SOURCE: U.S. Department of Education, Office for Civil Rights, Civil Rights Data Collection, 2011-12.

17
Race/Ethnicity Percent of Students with Disabilities by Race/Ethnicity All Suspensions/ Expulsions by Race/Ethnicity In-school Suspensions/ Expulsions by Race/Ethnicity Out-of-School Suspensions/ Expulsions by Race/Ethnicity One to Ten Days of Suspension/ Expulsion by Race/Ethnicity Suspensions/ Expulsions More Than 10 Days by Race/Ethnicity American Indian or Alaska Native 0.8% 0.9%0.8%0.9%0.6% Asian0.7%0.2% 0.0% Black or African American 24.1%41.2%36.1%47.4%39.8%56.9% Hispanic/Latino9.1%5.9%6.9%4.6%5.9%5.4% Two or more races 2.0%2.7%3.0%2.4%2.8%2.5% Native Hawaiian or Other Pacific Islander 0.4%0.3% 0.2%0.3%0.4% White63.0%48.9%52.6%44.3%50.2%34.2% Total - All Races/Ethnicities 100.0% 2013 – 2014 Arkansas Students with Disabilities Suspensions/Expulsions by Race/Ethnicity

18
Table Discussion Looking at the data on your table, discuss with others: – What do you see in the data? – What are the implications? – What are the long term expectations for those students?

19
Why Equity, Inclusion and Opportunity: Addressing Success Gaps? Significant Disproportionality (SD) or disproportionate representation (DR) is more than a special education issue. – Resolving SD/DR or improving SDDR requires whole school/district approaches, not limited to special education SD for discipline or identification is often the first of disparate outcomes for youth with disabilities throughout their lives.
 or disproportionate representation (DR) is more than a special education issue. – Resolving SD/DR or improving SDDR requires whole school/district approaches, not limited to special education SD for discipline or identification is often the first of disparate outcomes for youth with disabilities throughout their lives..")
20
What is a success gap? Differences or “gaps” in a variety of educational factors and outcomes that affect the likelihood of educational success for some groups of students compared to their peers – Achievement – Identification and/or placement for special education – Suspension rates – College and career preparation – Graduation rates

21
What are the results of success gaps? Poor long-term outcomes for entire groups of students

23
Intended Audiences State departments of education Local school districts Schools TA providers, professional developers, & consultants working with districts and schools Other stakeholders concerned about equity issues in schools General Ed. and Special Ed.

24
To address success gaps… … look closely at equity, inclusion, and opportunity for children in the affected groups

25
Structure of the Document(s) White paper: Introductory research brief Self-assessment rubric
 White paper: Introductory research brief Self-assessment rubric")
26
Investigate the root causes of your success gaps Have you implemented these five elements? Data-based decision making Cultural responsiveness High-quality core instructional program Universal screening and progress monitoring Evidence-based interventions and supports

27
Data-Based Decision Making Use disaggregated data for decisions about – Curriculum and instructional programs – Academic and behavioral supports – Are policies and procedures effective? Make decisions about student interventions using multiple data sources, including – Screening – Progress monitoring – Formative and summative evaluation data

28
Cultural Responsiveness Recognize diversity across student ethnicity, language, and socio-economic status Provide training and resources so teachers can meet the linguistic needs of all students Include parents from all backgrounds in discussions about the school and about their children’s progress

29
Core Instructional Program Rigorous, consistent, and well-articulated K-12 instructional program, aligned with standards, delivered with fidelity Effective differentiation in the core curriculum Universal design for learning Informing parents in their native or home language about differentiation

30
Assessment Valid universal screening Progress monitoring for all students Informing parents in their native or home language about results

31
Evidence-Based Interventions and Supports Implemented with fidelity Instructional Behavioral – such as Positive Behavioral Supports or Restorative Justice – Tiered response protocols, not zero tolerance Informing parents in their native or home language about interventions and responses

32
Table Discussion What do you think? In your school or district, there is room for improvement in: – Data based decision making – Cultural responsiveness – Core instructional program – Assessment – Evidence based interventions and support

34
To address success gaps…the plan of action Step One - Recognize the need for change in your school’s or district’s current practices and policies because you have identified a group of students who are experiencing success gaps. Step Two - Identify the root causes of the problem. Step Three - Make the changes that address those root causes.

35
How to Address Success Gaps 1.Form a team 2.Study the data 3.Conduct a self-assessment 4.Provide evidence 5.Consider the students first 6.Ensure equitable participation 7.Develop a plan of action

36
Cause Root Causes (EIO) Root Causes (EIO) Success Gaps 36.50% Graduation Gap MID Identification Rate for Black Students is Twice the Rate for White Students 8% to 14% Gap on Reading assessment Identification Rate for Male Students is Twice the Rate for Female Students OSS >10 Days Exclusion Rate Is 4 Times Greater for Black SWD Than White SWD 4.3% Gap More than 15 days absent 16% to 28% Gap on Math assessment Data-based decision making Cultural responsiveness High-quality Core instructional program Universal screening and progress monitoring Evidence-based Interventions and supports
 Root Causes (EIO) Success Gaps 36.50% Graduation Gap MID Identification Rate for Black Students is Twice the Rate for White Students 8% to 14% Gap on Reading assessment Identification Rate for Male Students is Twice the Rate for Female Students OSS >10 Days Exclusion Rate Is 4 Times Greater for Black SWD Than White SWD 4.3% Gap More than 15 days absent 16% to 28% Gap on Math assessment Data-based decision making Cultural responsiveness High-quality Core instructional program Universal screening and progress monitoring Evidence-based Interventions and supports")
37
Not So Easy “Equity, inclusion and opportunity for all students is an important goal, but one that is not easily achieved.” (EIO)
")
38
Blytheville Public Schools Mrs. Jean Cole; Director of Support Services

39
Discipline is a two edged sword, so we must wield it carefully When a student is suspended out of school “Education is not preparation for life; education is life itself.” John Dewey I can not teach, nor can I provide the conditions “I never teach my pupils, I only provide the conditions in which they can learn” Albert Einstein

40
Intensive ISS Program Intensive ISS program was piloted in Blytheville Middle School Although piloted there, many of the attributes and strategies have been implemented in the Blytheville Public School District as a whole. Evidence to this fact are the following data slides

41
Discipline Data for Blytheville Primary School 2013-2014 209.75 Student Days of Out-of-School Suspension 2014-2015 155.18 Student Days of Out-of-School Suspension This is a 26% reduction

42
Discipline Data for Blytheville Elementary School 2013-2014 813.5 Student Days of Out-of-School Suspension 2014-2015 468.75 Student Days of Out-of-School Suspension This is a 42.37% reduction

43
Discipline Data for Blytheville Middle School 2013-2014 2,045.5 Student Days of Out-of-School Suspension 2014-2015 1,249 Student Days of Out-of-School Suspension This is a 38.94% Reduction

44
Discipline Data for Blytheville High School New Tech 2013-2014 3,423.62 Student Days of Out-of-School Suspension 2014-2015 1,431 Student Days of Out-of-School Suspension This is a 58.20% Reduction

45
Closing Remarks

46
Rubric Organization Content Area Probing Questions Rubric rating scale Indicator Text box to describe evidence to support rating of the team

47
Data-based Decision Making Indicator: Decisions about the school curriculum, instructional programs, academic and behavioral supports, and school improvement initiatives are based on data Read the probing questions and the scale. What data, based on your SD issue, would you disaggregate and pay particular attention to? Thinking about your self-assessment and your plan, are there still some gaps? How would you rate your district/schools? Do you need to amend your plan?

48
Table Discussion In your team, review the assigned section and discussion among yourselves. – How would you rate your district for this section? – Determine if there is more data you would want to review

49
Cultural Responsiveness Indicators: Culturally responsive instructional interventions and teaching strategies; Preparation for linguistic diversity; Facilitating the participation of parents Questions: Review the probing questions and consider your responses

50
Team Discussion In your team, review the assigned section and discuss among yourselves. – How would you rate your district for this section now – Use your data, your self-assessments and your CEIS plan as resources. – Determine if there is more data you want to review – Determine if there are gaps in your current reviews (such as the self-assessment, etc) – Identify some next steps for enhancing this section Prepare a summary of your discussion and plan to share with the group – Chart paper and markers provided
 – Identify some next steps for enhancing this section Prepare a summary of your discussion and plan to share with the group – Chart paper and markers provided.")
51
Other sections of the rubric Core Instructional Program – Consistent, well-articulated curriculum implemented with fidelity – Scientifically-based instructional program – Differentiated instruction – Informing parents and guardians about the core instructional program

52
Other sections of the rubric Assessment-universal screening and progress monitoring – Universal screening – Progress monitoring – Informing parents and guardians about screening and progress monitoring results

53
Other sections of the rubric Interventions and Supports – Evidence-based behavioral interventions and supports, in addition to core instruction, are embedded within a multi-tiered framework and implemented with fidelity – School-level practices use tiered response methods (MTSS) that include academic and behavioral interventions and supports – A comprehensive district-level school discipline policy – Parents and guardians are regularly informed, in their native or home language, of interventions provided to their children and their children’s responses to those interventions for academic and behavioral skills
 that include academic and behavioral interventions and supports – A comprehensive district-level school discipline policy – Parents and guardians are regularly informed, in their native or home language, of interventions provided to their children and their children’s responses to those interventions for academic and behavioral skills")
54
Table Discussion At your table, select one of the three remaining sections and discuss among yourselves. – How would you rate your district for this section now – Determine if there is more data you want to review – Determine if there are gaps in your current reviews (such as the self-assessment, etc)
.")
55
Planning the next steps Team discussion and planning to – Continue this conversation in the district with the full team – Consider if the right people are involved in the discussion

56
Further Resources Please provide feedback about the tools if you use them – Contact Nancy O’Hara (nancy.ohara@uky.edu) or Terry Long (terry.long@sped-data.com) with the IDC for further information or assistance.nancy.ohara@uky.eduterry.long@sped-data.com The documents can be found at www.ideadata.org www.ideadata.org Thank You!

57
The contents of this presentation were developed under grants from the U.S. Department of Education. However, the contents do not necessarily represent the policy of the Department of Education, and you should not assume endorsement by the Federal Government.

Similar presentations


>")


