Download presentation
Presentation is loading. Please wait.

1
Andrew Hall, Permit Manager, DAPC

2
Statistics on current installation permit status Installation Goals for 2012 Statistics on current operating permit status Operating Permit Goals for 2012

4
Data from STARS2: January through November 2011 Installation permits including GPs, PTIs, PTIOs State-wide workload of installation permits

5
585 Installation permits (GP & Non) Included 1421 EUs ~2.4 EU per Installation Permit 95.8 avg OEPA days 120.4 avg Total days
 Included 1421 EUs ~2.4 EU per Installation Permit 95.8 avg OEPA days avg Total days")
9
Reduce workload to “no backlog” level Reduce number of “old” permits Meet 14-day Completeness review goal Continue timely processing of CO reviews Further develop high priority “high communication” process Process Section Manager identified high priority permits using “high communication” process

10
Tracked through STARS2 Report Management Reports… Permits Status… DO/LAA: select one Types: PTI & PTIO Reasons: Initial Installation & Chapter 31 Mod & Not Yet Assigned

11
DO/Laa Current Installation Workload* and 2011 Goals DO/LaaCurrent Workload“Old” Permits*2012 Goal 01 – CDO23130 02 - NEDO18330 03 - NWDO36230 04 - Toledo405 05 - SWDO205 06 - SEDO531330 07 - Portsmouth8610 08 - RAPCA3010 13 - Cleveland13215 14 - HAMCO11015 15 - Canton8510 16 - Akron2110 Total18133200 *As of November 30, 2011, Old = DO/LAA/CO workflow >180

12
Continue current practice of limited review and rapid turn-around (CO goal) Develop guidance concerning when the “high communication” process is to be used, the process used and a revised fee procedure (CO goal) Develop guidance concerning processing of “old” permits
 Develop guidance concerning when the high communication process is to be used, the process used and a revised fee procedure (CO goal) Develop guidance concerning processing of old permits")
14
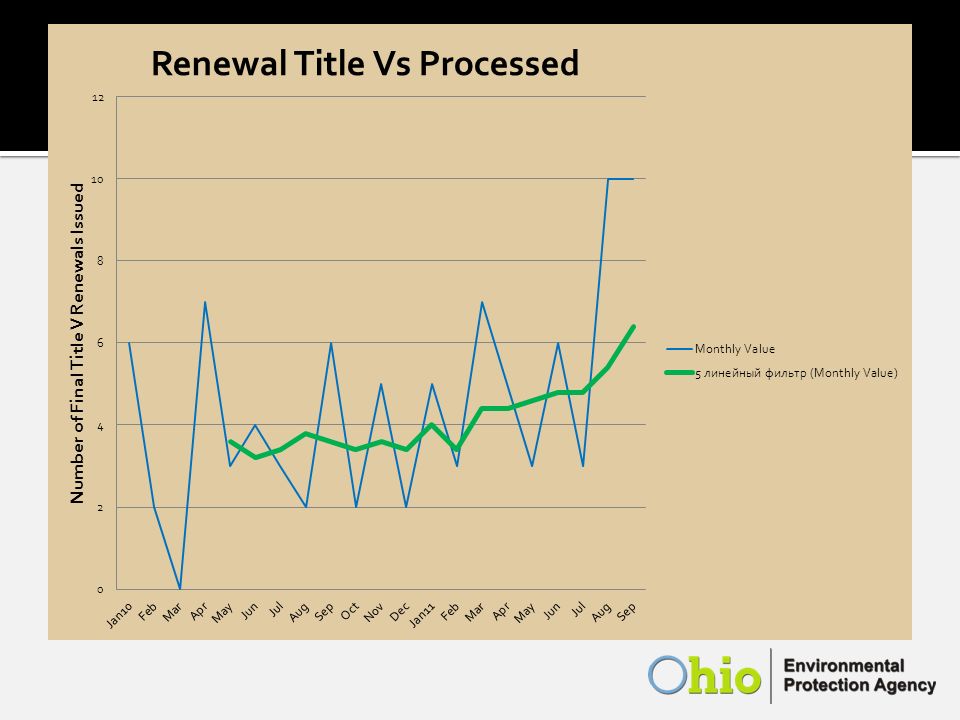
Gives actual number of Title Vs and non Title Vs issued Shows all of 2010 plus through Sept. 2011 Gives 5 month rolling numbers Shows doubling production from 2010 rate

17
Table has been revised based on recent STARS2 data Total renewal needed has dropped due to DO/LAA work to clean up data. This means # of needed renewals per 6- month period for each DO/LAA has changed (dropped) from previous chart.
 from previous chart..")
18
7/1/11 to 12/31/11 data is up to end of November data. 07/01/11 to 12/31/11 data does not include 01/01/11 to 06/30/11 data (not cumulated in that column).
..")
19
19 Title V and Non Title V Cumulative Actual Renewal Permits Processed Cumulative Title V Permits ProcessedCumulative Non Title V Permits Processed DO/Laa Average Needed 01/11- 06/30 07/11- 12/11 07/11- 06/12 07/11- 12/12 07/11- 06/13 07/11- 12/13 07/11- 06/14 Average Needed 01/11- 06/30 07/11- 12/11 07/11- 06/12 07/11- 12/12 07/11- 06/13 07/11- 12/13 07/11- 06/14 CDO6.00330000063.17143900000 NEDO8.17370000099.83405300000 NWDO4.50640000027.67446300000 TDES1.3322000007.0010700000 SWDO0.6700000004.675800000 SEDO11.00040000089.8363300000 PLAA1.1701000006.0014500000 RAPCA1.83440000020.33753200000 CDAQ4.50360000056.831095700000 HCDOES4.50720000045.83854900000 CCHD3.50000000018.6714800000 ARAQMD1.00150000016.17774000000 All DO/Laa48.17293800000456.0049339400000 8.03Monthly Average 76.00Monthly Average

20
Charts do not take into account renewal permits that were: Removed because they don’t need permits Changed to other permit types Removed from renewal category

21
21

22
22

23
Overall 2011 Title V goals on track 38 Final Title V’s issued –vs- 48 needed in 7/1/11 to 12/31/11 period 17 Title V PPs remain on November 30 th Fed 45-day waiver for PPs? Making good progress on non-Title V Renewals: 394 –vs- 456 needed

24
These charts track remaining renewals needing process vs. goals Goals are the same as previous chart, just reversed to number of renewals remaining instead of cumulative number of permits needing processed.

25
Charts do take into account renewal permits where it has been determined they no longer need to be processed. So far, on track. Will be more difficult as time goes on and we work on more difficult permits

28
First Round Volunteers – April, 2011 -eight staff - concrete batch plants, bodyshops, petroleum bulk plants, drycleaners, grain dryers/elevators, GDFs Second Round – October, 2011 - another eight staff - new categories: storage tanks, electroplaters, degreasers, incinerators/crematoriums 23 backlog permits issued to-date 33 backlog permits to PBR to-date

29
Active General Permits Available See: http://www.epa.ohio.gov/dapc/genpermit/genpermits.aspx http://www.epa.ohio.gov/dapc/genpermit/genpermits.aspx Aggregate Processing (2) Boilers (14) Compression Ignition Internal Combustion Engine (11) Perchloroethylene Drycleaning Operations (2) Mineral Extraction (1) Miscellaneous Metal Parts Painting Lines (7) Paved Roadways and Parking Areas (4) Ready Mix Concrete Batch Plants (2) Storage Piles (2) Unpaved Roadways and Parking Areas (2) Tub Grinders (1) Compression Ignition Internal Combustion Engine (2)
 Boilers (14) Compression Ignition Internal Combustion Engine (11) Perchloroethylene Drycleaning Operations (2) Mineral Extraction (1) Miscellaneous Metal Parts Painting Lines (7) Paved Roadways and Parking Areas (4) Ready Mix Concrete Batch Plants (2) Storage Piles (2) Unpaved Roadways and Parking Areas (2) Tub Grinders (1) Compression Ignition Internal Combustion Engine (2)")
30
General Permits Currently Under Development Agricultural Digester (3) – comment period ended 11/28 Oil/Gas well Site Production Operations (1) – comment period ended 11/28 Petroleum Solvent Drycleaners (5) Petroleum Loading Racks (2)
 – comment period ended 11/28 Oil/Gas well Site Production Operations (1) – comment period ended 11/28 Petroleum Solvent Drycleaners (5) Petroleum Loading Racks (2)")
31
Questions?

Similar presentations


 Mike Ahern & Bob Hodanbosi September 19, 2011.>")


 30 March 2011.>")

 Regulations 2011 Came into force on 29 th March 2011 Update some aspects of waste controls Regulations implement the revised.>")

>")

