Download presentation
Presentation is loading. Please wait.

1
Objectives Students will be able to label a stress-strain diagram correctly indicating. Ultimate stress, yield stress and proportional limit. Students will be able to calculate yield stress using the offset method. Students will be able to calculate true stress.

3
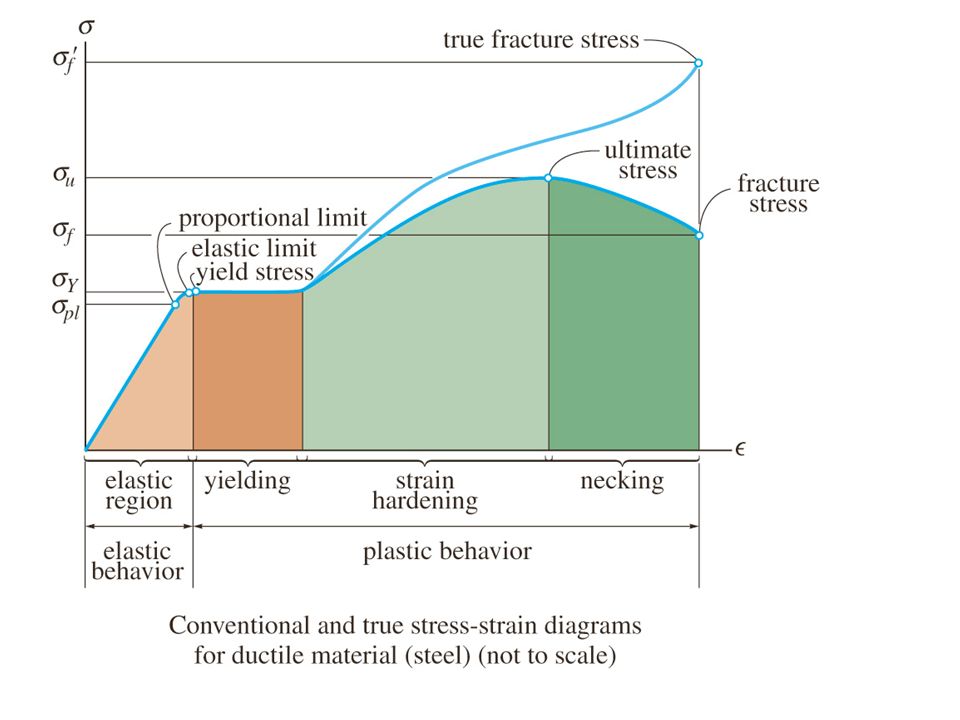
FIG. 1-10 Stress-strain diagram for a typical structural steel in tension (not to scale)
A- proportional limit; B – Yield stress; D – Ultimate stress; E – Fracture stress; E’ – True Fracture Stress

4
In reality samples will often ”neck”
In reality samples will often ”neck”. This necking leads to a reduction in cross sectional area and thus a localized increase in the stress in the necked region. True stress is therefore F/Ameasured

5
Stress-strain diagram for a typical structural steel in tension (drawn to scale)
For plastic materials such as steels the yielding, strain hardening and necking regions can be very large compared to the elastic region.

6
Sometimes stress-strain curves are drawn with two scales so that the elastic properties can be easily read. Figure: 03-06

7
Typical stress-strain diagram for an aluminum alloy.
Aluminum and aluminum alloys often do not have a well defined yield stress.

8
Arbitrary yield stress determined by the offset method
For materials such as aluminum the off-set method is often used to assign a value for the yield stress by drawing a line parallel to the elastic curve at an offset of (0.2%). The point of intersection is then the yield stress.
. The point of intersection is then the yield stress.")
9
Stress-strain curves for two kinds of rubber in tension
Rubber is a non-linear elastic material. The difference in stiffness of two rubbers is evident due to a difference in the slope of the curves.

10
Typical stress-strain diagram for a brittle material showing the proportional limit (point A) and fracture stress (point B) No yielding, or necking is evident. For brittle materials that fail the pieces still fit together e.g. glass or ceramics.

11
Stress-strain diagram for copper in compression
For materials such as aluminum the off-set method is often used to assign a value for the yield stress by drawing a line parallel to the elastic curve at an offset of (0.2%). The point of intersection is then the yield stress.
. The point of intersection is then the yield stress.")
12
Problems A tension test was performed on a steel specimen having an original diameter of in and gauge length of 2.00 in. Using the data listed in the table calculate and plot the stress strain diagram.

13
The stress-strain diagram for a steel alloy having an original diameter 0f 0.5 in and gauge length 2.0in is given in the figure. Determine the load on the sample that will cause yielding and the ultimate tensile load that the specimen will support. Figure: P3.5-07

Similar presentations