Download presentation
Presentation is loading. Please wait.

2
T.1-2 DESCRIPTION OF GENERAL DETAILS OF THE FIRM AND ORGANIZATION CHART T. 3 STRATEGY FOLLOWED TO GET A COMETITIVE ADVANTAGE T. 4-7 QUALITY FUNCTION DEPLOYMENT (QFD) AND PROCESS DESIGN T. 5 DESIGN AND PRODUCTION T. 6 OPERATIONS TECHNOLOGY
 AND PROCESS DESIGN T. 5 DESIGN AND PRODUCTION T. 6 OPERATIONS TECHNOLOGY.")
3
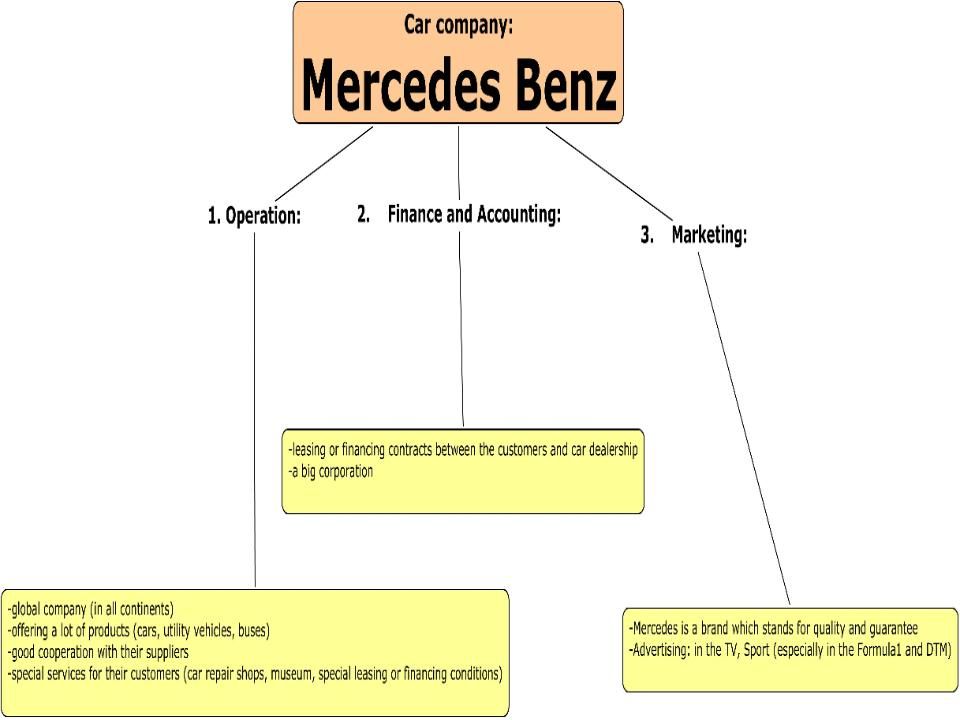
DESCRIPTION OF GENERAL DETAILS OF THE FIRM AND ORGANIZATION CHART

4
Headquarter: Stuttgart, Germany Production: Argentina, Austria, Bosnia and Herzegovina, Brazil, Canada, Egypt, Ghana, Hungary, India, Indonesia, Iran, Malaysia, Mexico, Nigeria, South Africa, South Korea, Thailand, Turke, United Kingdom USA Products: Passenger cars, Trucks, Buses and vans, Utility vehicles

5
1886 the first car was developed Foundation: 1887 Founders: Gottlieb Daimler Karl Benz 1894 first serial production Cooperation of: Mercedes (Daimler) and Benz because of bearing the crisis, until the 1926’s unification. 1928 the first formula 1 car(“Silber Pfeil”) was built
 was built.")
6
Cars for middle and upper class. They try to offer high quality cars at good relation price-quality. Prices vary depending on the model you are to buy. Their cars are always on the edge from a technological point of view since they have been produced with the best technological tools.

7
COMPETITORS Their strongest competitors come from the luxurious car’s market. Mercedes is supposed to be the strongest one in its field. Main Competitors: - BMW - Audi - VW -other car manufacture companies (Jaguar, Opel (GM) Porsche...
 Porsche....")
9
STRATEGY FOLLOWED TO GET A COMETITIVE ADVANTAGE

10
THE STRATEGY FOLLOWED BY MERCEDES BENZ TO BECAME LEADERS IN THE CAR MARKET ARE: DIFFERENTIATION VERSATILITY BROAD SCOPE THE PORTER’S GENERIC STRATEGIES: THE DIFFERENTITATION STRATEGY (horizontal axis) THE COST LEADERSHIP STRATEGY (horizontal axis) STRATEGIC FOCUS AND SCOPE (vertical axis)
 THE COST LEADERSHIP STRATEGY (horizontal axis) STRATEGIC FOCUS AND SCOPE (vertical axis)")
11
Vertical axis: F O C U S Horizontal axis: DIFFERENTIATION // COST LEADERSHIP

12
1. DIFFERENTIATION INVOLVES MAKING OUR PRODUCT DIFFERENT AND MORE ATTRACTIVE THAN THOSE OF OUR COMPETITORS. FEATURESFUNCTIONALITYDURABILITY SUPPORT BRAND IMAGE THAT OUR CUSTOMERS VALUE

13
1. DIFFERENTIATION TO MAKE A SUCCESS OF A GENERIC DIFFERENTIATION STRATEGY, WE NEED: 1. Good research, development and innovation. 2. The ability to deliver high-quality products or services. 3. Effective sales and marketing

14
REASONS : 1. Reduce costs (labor, taxes, tariffs, etc.) 2. Improve supply chain 3. Provide better goods and services 4. Understand markets 5. Learn to improve operation 6. Attract and retain global talent GLOBALIZE DIFFERENTIATION DRAWBACK : HANDICAP BEING UNIQUE

15
2. THE COST LEADERSHIP STRATEGY REDUCING ITS ECONOMIC COSTS BELOW ITS COMPETITORS THE ABILITY OF A VALUABLE COST-LEADERSHIP COMPETITIVE STRATEGY TO GENERATE A SUSTAINTED COMPETITIVE ADVANTAGE DEPENDS ON THAT STRATEGY BEING RARE AND COSTLY TO IMITATE. VERSTILTYVERSTILTY

16
THIS DIMENSION IS NOT A SEPARATE STRATEGY PER SE, BUT DESCRIBES THE SCOPE OVER WHICH THE COMPANY SHOULD COMPETE BASED ON COST LEADERSHIP OR DIFFERENTIATION. THE FIRM CAN CHOOSE TO COMPETE IN: THE MASS MARKET WITH A BROAD SCOPE, A DEFINED, FOCUSED MARKET SEGMENT WITH A NARROW SCOPE. MERCEDES BROAD SCOPE 3. FOCUS OR STRATEGIC SCOPE

17
QUALITY FUNCTION DEPLOYMENT (QFD)
")
19
Customer Room (What customers want) This is the “voice of the customer” Done With focus groups Must be what customers want and not what builder wants
 This is the voice of the customer Done With focus groups Must be what customers want and not what builder wants")
20
Engineering Room This is the HOW room, How can each customer attribute be measured and evaluated by the company.

21
Integrator room These are the What's’ in rows and How's in columns This s the relationship room Described in 3 ways: Strong moderate and weak

22
Competitors room This room assesses how well we are meeting customers requirements

23
Tester Room Technical priorities Relationship and importance to customer

24
The Attic

25
About quality cost analysis (http://www.kaner.com/qualcost. htm)http://www.kaner.com/qualcost. htm
 htm")
26
Content Definition quality cost Different types of Quality cost analysis ○ Prevention costs ○ Appraisal costs ○ Internal failure costs ○ External failure costs Benefits by analysis cost of quality Risks by analysis cost of quality

27
Definition Quality Cost: - It is represented by the costs encountered in: - preventing - finding - correcting the defective work -They represent in general a significant amount -It is affected (reduced) by Total Quality Control.
 by Total Quality Control.")
28
Prevention costs The costs encountered in the activities preventing poor quality. Examples: Staff training Early Prototyping/Requirements analysis Clear Specification/unambiguous documentation Evaluation of the development tools that will be used Coding errors Design errors Mistakes in the user manuals Dadly documented or unmaintainably complex code

29
Appraisal Costs: The Costs encountered in the activities aimed at revealing quality problems. Examples: Design review Testing the raw materials Quality control Training testers Test automation Usability testing Pre-release out-of-box testing by customer service staff

30
Internal Failure Failure costs are Costs that result from poor quality: Bug fixes Regression testing Wasted in-house user time Wasted tester time Wasted writer time Wasted marketer time Wasted advertisements Direct cost of late shipment Opportunity cost of late shipment

31
External Failure Costs Customer service costs Cost of patching a released product distributing the patch Examples are: Lost sales Lost customer goodwill Discounts to resellers to encourage them to keep selling the product Warranty costs Preparation of support answer books Investigation of customer complaints Refunds and recalls Coding / testing of interim bug fix releases Shipping of updated product

32
Risks Implementation Risks – Not being realistic and trying to achieve too much too soon. – Controversial costs should be left aside, especially the first few times the company is trying to implement the quality-costs analysis Other risks: – Looking only from the point of view of the company, not looking at the customer’s costs – Might result in other types of risk: Customer Dissatisfaction Litigation

33
Benefits The goal is to reach minimum quality costs at the desired outgoing quality level. It’s a feed-back mechanism: quality costs data is used by the management to make decisions that will impact the quality costs. Applications of Quality Costs – Measurement Tool: Quality costs provide comparative measurements for evaluating quality programs – Process-Quality Analysis Tool Quality costs can serve effectively as an analysis tool and point out where the problems are – Programming Tool Quality costs determine how the available resources to be divided – Predictive Tool Quality costs can also be used to evaluate and assure performance in relation to the goals and objectives of the organization.

34
Operations technology in Mercedes Benz

35
Products Technologically innovators Technology used to manufacture these products

36
CAD in Mercedes Benz Two kinds of software Mechanical and engineering orientated software Design in itself software

37
Production Technology The cad design has to be integrated in the machine. Numerical controled Robots

38
Internet & more corporative Software Web page informing aabout their services, new releases and news. www.mercedes-benz.com In 1995 they firmed aa contract with IBM to support all the corporative software. (accounting, net, design)
.")
39
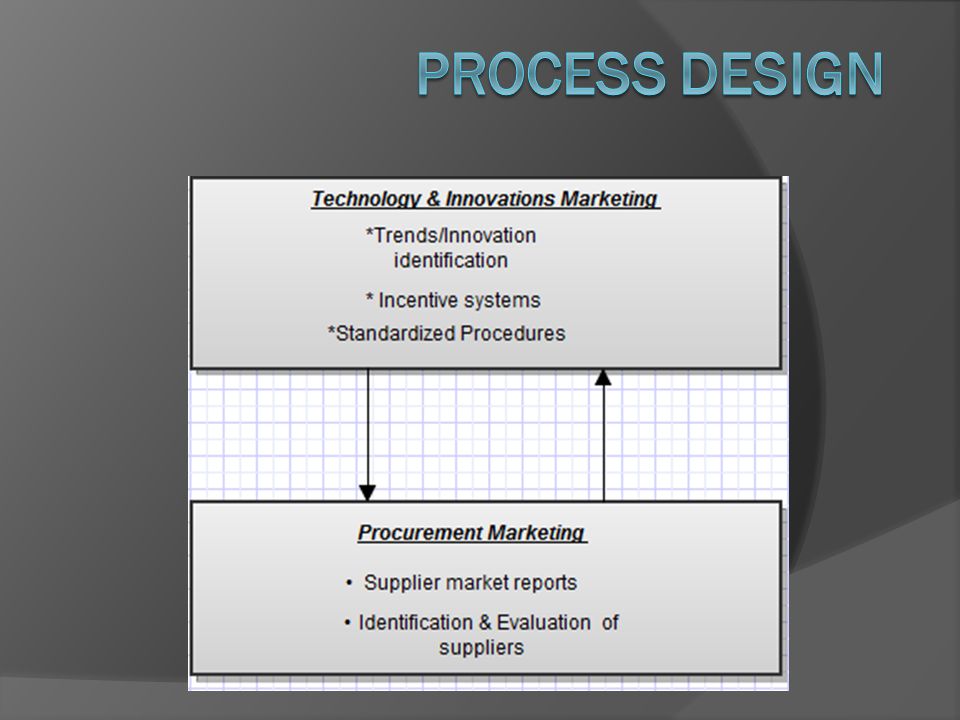
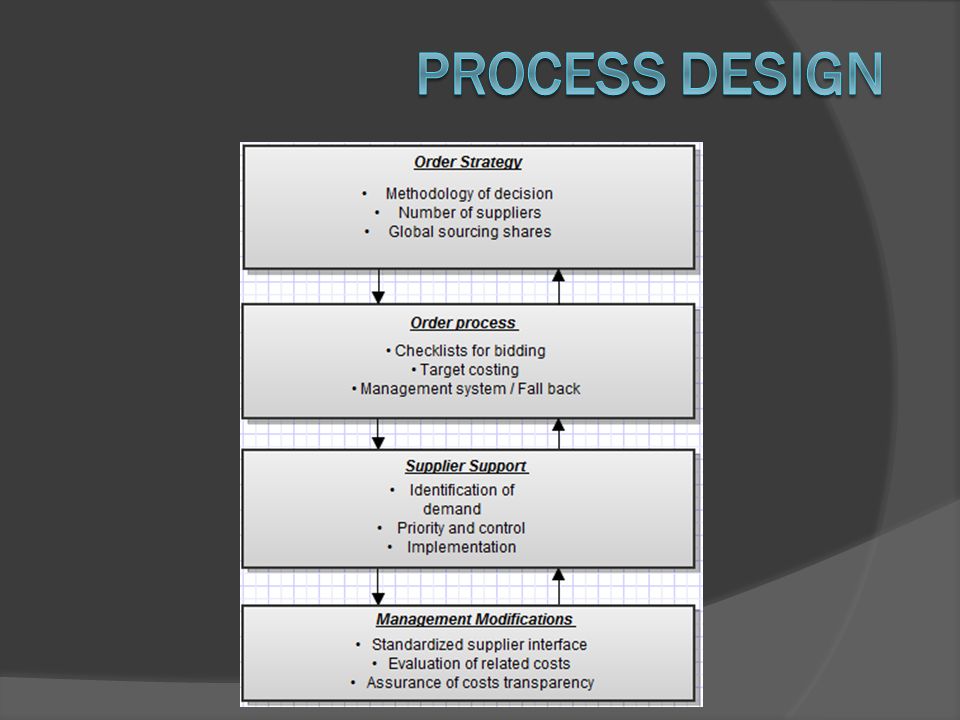
DESCRIBE A PROCESS IN OUR FIRM USING ANY OF THE TOOLS FOR PROCESS DESIGN.

Similar presentations


, apply these concepts to the design (and production) of the product.>")


