Download presentation
Presentation is loading. Please wait.

1
Ecosystems: What Are They and How Do They Work?
Chapter 3 Ecosystems: What Are They and How Do They Work?

2
Chapter Overview Questions
What is ecology? What are the major components of an ecosystem? What basic processes keep us and other organisms alive? What happens to matter in an ecosystem? What happens to energy in an ecosystem? How do scientists study ecosystems?

3
Core Case Study: Tropical Rain Forests Are Disappearing
3

4
Tropical Rain Forests Are Disappearing
Cover about 2% of the earth’s land surface, but produce about 25% of Earth’s oxygen Contain about 50% of the world’s known terrestrial plant and animal species Disruption will have three major harmful effects Reduce biodiversity Accelerate climate change Change regional weather patterns 4

5
Core Case Study: Tropical Rain Forests Are Disappearing
The current global rate of rainforest destruction is 1.5 acres per second. There is disagreement about what might eventually happen If current rates of deforestation continue, virtually all of the world’s rainforests will be gone within 40 years. But a LOT is being done to reverse this trend, and many formerly deforested areas are re-growing… but they rarely come back the way they were before being cut. 5

6
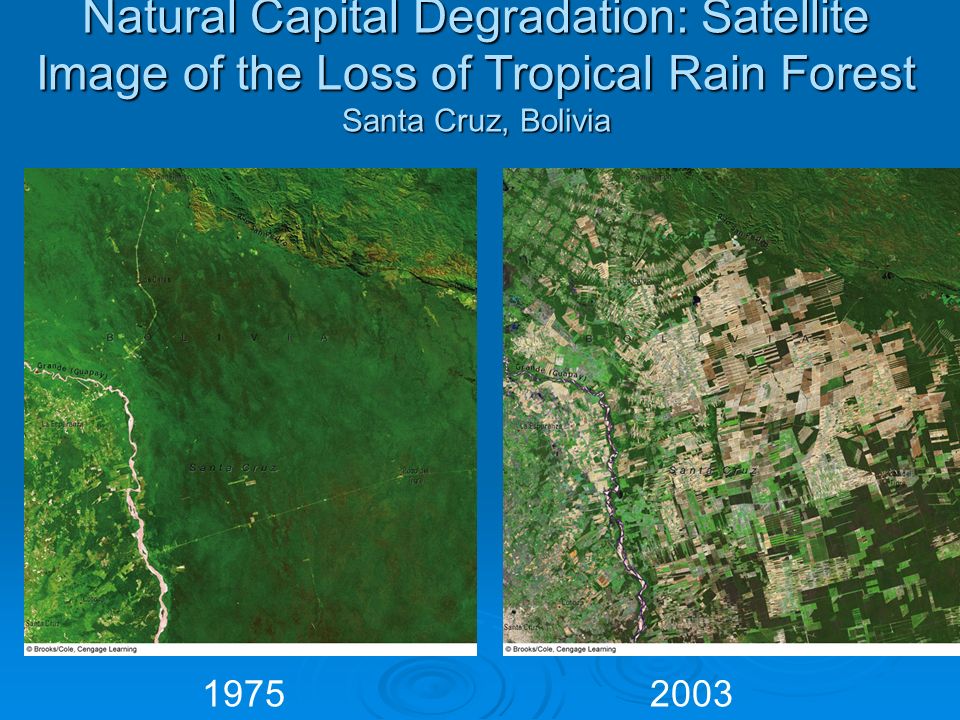
Natural Capital Degradation: Satellite Image of the Loss of Tropical Rain Forest Santa Cruz, Bolivia
1975 2003 6
7
THE NATURE OF ECOLOGY Ecology is a study of connections in nature.
How organisms interact with one another and with their nonliving environment. Put another way: Biotic & Abiotic Interactions Next

8
Biosphere Ecosystems Realm of ecology Communities Populations
Universe Galaxies Biosphere Solar systems Planets Earth Biosphere Ecosystems Ecosystems Communities Populations Realm of ecology Organisms Communities Organ systems Organs Figure 3.2 Natural capital: levels of organization of matter in nature. Ecology focuses on five of these levels. Tissues Cells Populations Protoplasm Molecules Atoms Organisms Subatomic Particles Fig. 3-2, p. 51

9
Organisms and Species Organisms, the different forms of life on earth, can be classified into different species based on certain characteristics. Next

10
Other animals 281,000 Known species 1,800,000 Insects 751,000 Fungi
69,000 Prokaryotes 4,800 Figure 3.3 Natural capital: breakdown of the earth’s 1.4 million known species. Scientists estimate that there are 4 million to 100 million species. Plants 248,400 Protists 57,700

11
Have You Thanked the Insects Today?
Many plant species depend on insects for pollination. Insect can control other pest insects by eating them Insects are prey for MANY other species… Figure 3-1

12
Core Case Study: Have You Thanked the Insects Today?
“…if all insects disappeared, humanity probably could not last more than a few months” -E.O. Wilson, biodiversity expert

13
E.O. Wilson World’s foremost authority on biodiversity

14
Case Study: Which Species Run the World?
We could not live without the multitudes of tiny microbes such as bacteria, protozoa, and fungi. Harmful microbes are the minority. Soil bacteria convert nitrogen gas to a usable form for plants. They help produce foods (bread, cheese, yogurt, beer, wine). 90% of all living mass. (!) Help purify water, provide oxygen, break down waste. Live beneficially in your body (intestines, nose).
. 90% of all living mass. (!) Help purify water, provide oxygen, break down waste. Live beneficially in your body (intestines, nose).")
15
Populations, Communities, and Ecosystems
Members of a species interact in groups called populations. Populations of different species living and interacting in an area form a community. A community interacting with its physical environment of matter and energy is an ecosystem.

16
Populations A population is a group of interacting individuals of the same species occupying a specific area. The space an individual or population normally occupies is its habitat. The niche of a species is it’s total way of life, a “larger” concept than mere habitat. Monarch Butterflies Figure 3-4

17
Populations Genetic diversity
In most natural populations individuals vary slightly in their genetic makeup. Variation among one species of Caribbean snail! Figure 3-5

18
Ecosystem Basics: What Supports the Biosphere?
The biosphere consists of several physical layers that contain: sphere? Air Water Soil Minerals Life Figure 3-6

19
(living and dead organisms) (crust, top of upper mantle)
Oceanic Crust Continental Crust Atmosphere Vegetation and animals Biosphere Lithosphere Soil Upper mantle Crust Rock Asthenosphere Lower mantle Core Mantle Figure 3.6 Natural capital: general structure of the earth. Crust (soil and rock) Biosphere (living and dead organisms) Hydrosphere (water) Lithosphere (crust, top of upper mantle) Atmosphere (air) Fig. 3-6, p. 54
 Biosphere. (living and dead organisms) Hydrosphere (water) Lithosphere. (crust, top of upper mantle) Atmosphere (air) Fig. 3-6, p. 54.")
20
What Supports the Biosphere?
Atmosphere Membrane of air around the planet. Troposphere: lowest layer; we live in this! Stratosphere: miles up Lower portion contains stratospheric ozone to filter out most of the sun’s harmful UV radiation. Hydrosphere All the earth’s water: liquid, ice, water vapor Lithosphere The earth’s crust and upper mantle. Geosphere The entire solid earth

21
What Sustains Life on Earth?
Solar energy, the cycling of matter, and gravity sustain the earth’s life. Figure 3-7

22
Carbon cycle Phosphorus cycle Nitrogen cycle Water cycle Oxygen cycle
Biosphere Carbon cycle Phosphorus cycle Nitrogen cycle Water cycle Oxygen cycle Figure 3.7 Natural capital: life on the earth depends on the flow of energy (wavy arrows) from the sun through the biosphere and back into space, the cycling of crucial elements (solid arrows around ovals), and gravity, which keeps atmospheric gases from escaping into space and helps recycle nutrients through air, water, soil, and organisms. This simplified model depicts only a few of the many cycling elements. Heat in the environment Heat Heat Heat Fig. 3-7, p. 55
 from the sun through the biosphere and back into space, the cycling of crucial elements (solid arrows around ovals), and gravity, which keeps atmospheric gases from escaping into space and helps recycle nutrients through air, water, soil, and organisms. This simplified model depicts only a few of the many cycling elements. Heat in the environment. Heat. Heat. Heat. Fig. 3-7, p. 55.")
23
What Happens to Solar Energy Reaching the Earth?
Solar energy flowing through the biosphere warms the atmosphere, evaporates and recycles water, generates winds and supports plant growth. Figure 3-8

24
1 billionth of total solar energy reaches the earth!
radiation Energy in = Energy out Reflected by atmosphere (34% ) Radiated by atmosphere as heat (66%) UV radiation Lower Stratosphere (ozone layer) Absorbed by ozone Visible Light Greenhouse effect Troposphere Heat Figure 3.8 Solar capital: flow of energy to and from the earth. Absorbed by the earth Heat radiated by the earth Fig. 3-8, p. 55
 Radiated by. atmosphere as heat (66%) UV radiation. Lower Stratosphere. (ozone layer) Absorbed. by ozone. Visible. Light. Greenhouse. effect. Troposphere. Heat. Figure 3.8. Solar capital: flow of energy to and from the earth. Absorbed. by the earth. Heat radiated. by the earth. Fig. 3-8, p. 55.")
25
ECOSYSTEM COMPONENTS Life exists on land systems called biomes and in freshwater aquatic and marine aquatic life zones. Figure 3-9

26
39th parallel transect across the USA Average annual precipitation
100–125 cm (40–50 in.) 75–100 cm (30–40 in.) 50–75 cm (20–30 in.) 4,600 m (15,000 ft.) 25–50 cm (10–20 in.) 3,000 m (10,000 ft.) below 25 cm (0–10 in.) 1,500 m (5,000 ft.) Coastal mountain ranges Sierra Nevada Mountains Great American Desert Rocky Mountains Great Plains Mississippi River Valley Appalachian Mountains Figure 3.9 Natural capital: major biomes found along the 39th parallel across the United States. The differences reflect changes in climate, mainly differences in average annual precipitation and temperature. Coastal chaparral and scrub Coniferous forest Desert Coniferous forest Prairie grassland Deciduous forest Fig. 3-9, p. 56
 75–100 cm (30–40 in.) 50–75 cm (20–30 in.) 4,600 m (15,000 ft.) 25–50 cm (10–20 in.) 3,000 m (10,000 ft.) below 25 cm (0–10 in.) 1,500 m (5,000 ft.) Coastal. mountain. ranges. Sierra. Nevada. Mountains. Great. American. Desert. Rocky. Mountains. Great. Plains. Mississippi. River Valley. Appalachian. Mountains. Figure 3.9. Natural capital: major biomes found along the 39th parallel across the United States. The differences reflect changes in climate, mainly differences in average annual precipitation and temperature. Coastal chaparral. and scrub. Coniferous forest. Desert. Coniferous forest. Prairie grassland. Deciduous forest. Fig. 3-9, p. 56.")
27
Nonliving and Living Components of Ecosystems
Ecosystems consist of nonliving (abiotic) and living (biotic) components. Figure 3-10
 and living (biotic) components. Figure")
28
Falling leaves and twigs Soluble mineral nutrients
Oxygen (O2) Sun Producer Carbon dioxide (CO2) Secondary consumer (fox) Primary consumer (rabbit) Precipitation Producers Falling leaves and twigs Figure 3.10 Natural capital: major components of an ecosystem in a field. Soil decomposers Water Soluble mineral nutrients Fig. 3-10, p. 57
 Sun. Producer. Carbon dioxide (CO2) Secondary consumer. (fox) Primary. consumer. (rabbit) Precipitation. Producers. Falling leaves and twigs. Figure Natural capital: major components of an ecosystem in a field. Soil decomposers. Water. Soluble mineral nutrients. Fig. 3-10, p. 57.")
29
Factors That Limit Population Growth
Availability of matter and energy resources can limit the number of organisms in a population. Figure 3-11

30
Lower limit of tolerance Upper limit of tolerance
No organisms Few organisms Few organisms No organisms Abundance of organisms Population size Figure 3.11 Natural capital: range of tolerance for a population of organisms, such as fish, to an abiotic environmental factor—in this case, temperature. These restrictions keep particular species from taking over an ecosystem by keeping their population size in check. Zone of intolerance Zone of physiological stress Optimum range Zone of physiological stress Zone of intolerance Low Temperature High Fig. 3-11, p. 58

31
Limiting Factor Principal
Too much or too little of any one abiotic factor can limit or prevent the growth of a population, even if all other limiting factors are at or near the optimum range Figure 3-11

32
Factors That Limit Population Growth
The physical and chemical conditions of the environment can limit the distribution of a species. Figure 3-12

33
Sugar Maple Why does the sugar maple only grow in this range? CLIMATE is the most important factor that determines what biome grows in a particular area. Figure 3.12 The physical conditions of the environment can limit the distribution of a species. The green area shows the current range of sugar maple trees in eastern North America. (Data from U.S. Department of Agriculture) Fig. 3-12, p. 58
 Fig. 3-12, p. 58.")
34
Limiting Factors Terrestrial Ecosystems:
Physical or Chemical? Limiting Factors Terrestrial Ecosystems: *Water *Major Soil nutrients *Temperature NH3, NH4+ NO2-, NO3- PO4- K+ Aquatic Ecosystems: *Temperature *Sunlight *Dissolved O2 “DO” *Nutrients (see above) *Salinity
 *Salinity.")
35
Producers: Basic Source of All Food
Most producers capture sunlight to produce carbohydrates by photosynthesis: Producers form the base of all food chains on earth, so the limiting factors that act upon producers are critical in determining what grows in a particular area.

36
Producers: Basic Source of All Food
Photosynthesis: source of ALMOST ALL food exception Chemosynthesis: “Sea Vent Community”- Some organisms such as deep ocean bacteria draw energy from hydrothermal vents and produce carbohydrates from the chemical energy in hydrogen sulfide (H2S) gas . Some chemosynthetic bacteria are found in hot springs and geysers (as found in Yellowstone National Park)
 gas . Some chemosynthetic bacteria are found in hot springs and geysers (as found in Yellowstone National Park)")
37
Sea Vent Community Found in deep sea hydrothermal vents

38
Sea Vent Community Found in deep sea hydrothermal vents

39
Sea Vent Community- Tube Worms

40
Photosynthesis: A Closer Look
Chlorophyll molecules in the chloroplasts of plant cells absorb solar energy. This initiates a complex series of chemical reactions in which carbon dioxide and water are converted to sugars and oxygen. Figure 3-A

41
Sun Chloroplast in leaf cell Chlorophyll H2O Light-dependent Reaction
Figure 3.A Simplified overview of photosynthesis. In this process, chlorophyll molecules in the chloroplasts of plant cells absorb solar energy. This initiates a complex series of chemical reactions in which carbon dioxide and water are converted to sugars, such as glucose, and oxygen. H2O Light-dependent Reaction O2 Energy storage and release (ATP/ADP) Glucose Light-independent reaction CO2 Sunlight 6CO2 + 6 H2O C6H12O6 + 6 O2 Fig. 3-A, p. 59
 Glucose. Light-independent. reaction. CO2. Sunlight. 6CO2 + 6 H2O. C6H12O6 + 6 O2. Fig. 3-A, p. 59.")
42
Consumers: Eating and Recycling to Survive
Consumers (heterotrophs) get their food by eating or breaking down all or parts of other organisms or their remains. Herbivores Primary consumers that eat producers Carnivores Secondary consumers: Carnivores that eat primary consumers Tertiary and higher level consumers: Carnivores that eat carnivores. Omnivores Feed on both plant and animals.
 get their food by eating or breaking down all or parts of other organisms or their remains. Herbivores. Primary consumers that eat producers. Carnivores. Secondary consumers: Carnivores that eat primary consumers. Tertiary and higher level consumers: Carnivores that eat carnivores. Omnivores. Feed on both plant and animals.")
43
Detritovores and Decomposers
Detritovores: Insects or other scavengers that feed on (consume) detritus (wastes or dead bodies). Decomposers: Absorb food & release inorganic nutrients into ecosystems. “B&F” (Bacteria & Fungi)
 detritus (wastes or dead bodies). Decomposers: Absorb food & release inorganic nutrients into ecosystems. B&F (Bacteria & Fungi)")
44
Scavengers a.k.a. Detritovores Decomposers
Termite and carpenter ant work Bark beetle engraving Carpenter ant galleries Long-horned beetle holes Dry rot fungus Wood reduced to powder Figure 3.13 Natural capital: various scavengers (detritivores) and decomposers (mostly fungi and bacteria) can “feed on” or digest parts of a log and eventually convert its complex organic chemicals into simpler inorganic nutrients that can be taken up by producers. Mushroom Time progression Powder broken down by bacteria and fungi into plant nutrients in soil Fig. 3-13, p. 61
 and decomposers (mostly fungi and bacteria) can feed on or digest parts of a log and eventually convert its complex organic chemicals into simpler inorganic nutrients that can be taken up by producers. Mushroom. Time progression. Powder broken down by bacteria and fungi into plant nutrients in soil. Fig. 3-13, p. 61.")
45
Aerobic and Anaerobic Respiration: Getting Energy for Survival
Organisms break down carbohydrates and other organic compounds in their cells to obtain the energy they need. This is usually done through aerobic respiration (uses oxygen) The opposite of photosynthesis
 The opposite of photosynthesis.")
46
Aerobic and Anaerobic Respiration: Getting Energy for Survival
Anaerobic respiration or fermentation: Some decomposers get energy by breaking down glucose (or other organic compounds) in the absence of oxygen. The end products vary based on the chemical reaction: Methane gas- methanogens in our intestines or in sediments Ethyl alcohol- yeast that make alcohol Acetic acid- bacteria that make vinegar Hydrogen sulfide- bacteria in the salt marsh
 in the absence of oxygen. The end products vary based on the chemical reaction: Methane gas- methanogens in our intestines or in sediments. Ethyl alcohol- yeast that make alcohol. Acetic acid- bacteria that make vinegar. Hydrogen sulfide- bacteria in the salt marsh.")
47
Two Secrets of Survival: Energy Flow and Matter Recycle
An ecosystem survives by a combination of energy flow and matter recycling. Figure 3-14

48
a.k.a. inorganic chemicals
Abiotic chemicals (carbon dioxide, oxygen, nitrogen, minerals) Heat Solar energy Heat Heat Producers (plants) Decomposers (bacteria, fungi) Figure 3.14 Natural capital: the main structural components of an ecosystem (energy, chemicals, and organisms). Matter recycling and the flow of energy—first from the sun, then through organisms, and finally into the environment as low-quality heat—links these components. Consumers (herbivores, carnivores) Heat Heat Fig. 3-14, p. 61
 Heat. Solar. energy. Heat. Heat. Producers. (plants) Decomposers. (bacteria, fungi) Figure Natural capital: the main structural components of an ecosystem (energy, chemicals, and organisms). Matter recycling and the flow of energy—first from the sun, then through organisms, and finally into the environment as low-quality heat—links these components. Consumers. (herbivores, carnivores) Heat. Heat. Fig. 3-14, p. 61.")
49
ENERGY FLOW IN ECOSYSTEMS
Food chains and webs show how eaters, the eaten, and the decomposed are connected to one another in an ecosystem. Next

50
Solar energy Detritivores and Decomposers
First Trophic Level Second Trophic Level Third Trophic Level Fourth Trophic Level Producers (plants) Primary consumers (herbivores) Secondary consumers (carnivores) Tertiary consumers (top carnivores) Heat Heat Heat Solar energy Heat Heat Figure 3.17 Natural capital: a food chain. The arrows show how chemical energy in food flows through various trophic levels in energy transfers; most of the energy is degraded to heat, in accordance with the second law of thermodynamics. Heat Heat Detritivores and Decomposers Heat Fig. 3-17, p. 64
 Primary consumers. (herbivores) Secondary consumers. (carnivores) Tertiary consumers. (top carnivores) Heat. Heat. Heat. Solar energy. Heat. Heat. Figure Natural capital: a food chain. The arrows show how chemical energy in food flows through various trophic levels in energy transfers; most of the energy is degraded to heat, in accordance with the second law of thermodynamics. Heat. Heat. Detritivores. and Decomposers. Heat. Fig. 3-17, p. 64.")
51
Food Webs Trophic levels are interconnected within a more complicated food web. Next

52
Carnivorous Zooplankton
Humans Blue whale Sperm whale Crabeater seal Elephant seal Killer whale Leopard seal Adelie penguins Emperor penguin Squid Figure 3.18 Natural capital: a greatly simplified food web in the Antarctic. Many more participants in the web, including an array of decomposer organisms, are not depicted here. Petrel Fish Carnivorous Zooplankton Krill Herbivorous Zooplankton Phytoplankton Fig. 3-18, p. 65

53
Energy Flow in an Ecosystem: Losing Energy in Food Chains and Webs
In accordance with the 2nd law of thermodynamics, there is a decrease in the amount of energy available to each succeeding organism in a food chain or web.

54
Energy Flow in an Ecosystem: Losing Energy in Food Chains and Webs
Ecological efficiency: percentage of useable energy transferred as biomass from one trophic level to the next. 10% most commonly 2% to 40% range in different ecosystems Figure 3-19

55
Heat Heat Tertiary consumers Decomposers (human) Heat 10 Secondary
(perch) Heat 100 Primary consumers (zooplankton) Figure 3.19 Natural capital: generalized pyramid of energy flow showing the decrease in usable energy available at each succeeding trophic level in a food chain or web. In nature, ecological efficiency varies from 2% to 40%, with 10% efficiency being common. This model assumes a 10% ecological efficiency (90% loss in usable energy to the environment, in the form of low-quality heat) with each transfer from one trophic level to another. QUESTION: Why is it a scientific error to call this a pyramid of energy? 1,000 Heat 10,000 Usable energy Available at Each tropic level (in kilocalories) Producers (phytoplankton) Fig. 3-19, p. 66
 Heat Primary. consumers. (zooplankton) Figure Natural capital: generalized pyramid of energy flow showing the decrease in usable energy available at each succeeding trophic level in a food chain or web. In nature, ecological efficiency varies from 2% to 40%, with 10% efficiency being common. This model assumes a 10% ecological efficiency (90% loss in usable energy to the environment, in the form of low-quality heat) with each transfer from one trophic level to another. QUESTION: Why is it a scientific error to call this a pyramid of energy 1,000. Heat. 10,000. Usable energy. Available at. Each tropic level. (in kilocalories) Producers. (phytoplankton) Fig. 3-19, p. 66.")
56
Productivity of Producers: The Rate Is Crucial
Gross primary production (GPP) Rate at which an ecosystem’s producers convert solar energy into chemical energy as biomass. Figure 3-20
 Rate at which an ecosystem’s producers convert solar energy into chemical energy as biomass. Figure")
57
Gross primary productivity (grams of carbon per square meter)
Figure 3.20 Natural capital: gross primary productivity across the continental United States based on remote satellite data. The differences roughly correlate with variations in moisture and soil types. (NASA’s Earth Observatory) Gross primary productivity (grams of carbon per square meter) Fig. 3-20, p. 66
 Gross primary productivity. (grams of carbon per square meter) Fig. 3-20, p. 66.")
58
Net Primary Production (NPP)
NPP = GPP – R Rate at which producers use photosynthesis to store energy minus the rate at which they (the producers) use some of this energy through respiration (R). Figure 3-21
 use some of this energy through respiration (R). Figure")
59
and unavailable to consumers Respiration
Sun Photosynthesis Energy lost and unavailable to consumers Respiration Gross primary production Net primary production (energy available to consumers) Figure 3.21 Natural capital: distinction between gross primary productivity and net primary productivity. A plant uses some of its gross primary productivity to survive through respiration. The remaining energy is available to consumers. Growth and reproduction Fig. 3-21, p. 66
 Figure Natural capital: distinction between gross primary productivity and net primary productivity. A plant uses some of its gross primary productivity to survive through respiration. The remaining energy is available to consumers. Growth and reproduction. Fig. 3-21, p. 66.")
60
What are nature’s three most productive and three least productive systems?
Next

61
Average net primary productivity (kcal/m2 /yr)
Terrestrial Ecosystems Swamps and marshes Tropical rain forest Temperate forest North. coniferous forest Savanna Agricultural land Woodland and shrubland Temperate grassland Tundra (arctic and alpine) Desert scrub Extreme desert Aquatic Ecosystems Estuaries (salt marsh or mangrove forest) Lakes and streams Continental shelf Open ocean Figure 3.22 Natural capital: estimated annual average net primary productivity per unit of area in major life zones and ecosystems, expressed as kilocalories of energy produced per square meter per year (kcal/m2/yr). QUESTION: What are nature’s three most productive and three least productive systems? (Data from Communities and Ecosystems, 2nd ed., by R. H. Whittaker, New York: Macmillan) Average net primary productivity (kcal/m2 /yr) Fig. 3-22, p. 67
 Desert scrub. Extreme desert. Aquatic Ecosystems. Estuaries (salt marsh or mangrove forest) Lakes and streams. Continental shelf. Open ocean. Figure Natural capital: estimated annual average net primary productivity per unit of area in major life zones and ecosystems, expressed as kilocalories of energy produced per square meter per year (kcal/m2/yr). QUESTION: What are nature’s three most productive and three least productive systems (Data from Communities and Ecosystems, 2nd ed., by R. H. Whittaker, New York: Macmillan) Average net primary productivity (kcal/m2 /yr) Fig. 3-22, p. 67.")
62
MATTER CYCLING IN ECOSYSTEMS
Nutrient Cycles: Global Recycling Global Cycles recycle nutrients through the earth’s air, land, water, and living organisms. C, H2O, S, N, P Biogeochemical cycles move these substances through air, water, soil, rock and living organisms.

63
Characterizing Biogeochemical Cycles Where is Most of the Matter?
Biogeochemical cycles are characterized by where the major reservoir of that compound or element is stored Water- On average, a water molecule stays in the ocean for 3,000 years, while it stays in the atmosphere only 9 days. Carbon- Most carbon is stored as dissolved carbonic acid in the ocean and fossil fuels in the earth’s crust. Nitrogen- atmospheric Phosphorous- sedimentary Sulfur- Sedimentary

64
The Hydrologic Cycle Condensation Transpiration Evaporation
Rain clouds Transpiration Evaporation Precipitation to land Transpiration from plants Precipitation Precipitation Evaporation from land Evaporation from ocean Surface runoff (slow) Runoff Precipitation to ocean Infiltration Surface runoff (rapid) Figure 3.26 Natural capital: simplified model of the hydrologic cycle. Percolation: Groundwater movement (slow) Ocean storage Fig. 3-26, p. 72
 Runoff. Precipitation to ocean. Infiltration. Surface runoff (rapid) Figure Natural capital: simplified model of the hydrologic cycle. Percolation: Groundwater movement (slow) Ocean storage. Fig. 3-26, p. 72.")
65
Water’s Unique Properties
There are strong forces of attraction between molecules of water (allows transpiration) Water exists as a liquid over a wide temperature range. Liquid water changes temperature slowly. It takes a large amount of energy for water to evaporate. Liquid water can dissolve a variety of compounds. Water expands when it freezes.
 Water exists as a liquid over a wide temperature range. Liquid water changes temperature slowly. It takes a large amount of energy for water to evaporate. Liquid water can dissolve a variety of compounds. Water expands when it freezes.")
66
Effects of Human Activities on Water Cycle
We alter the water cycle by: Withdrawing large amounts of freshwater. Clearing vegetation and eroding soils. Polluting surface and underground water. Contributing to climate change.

67
The Carbon Cycle: Part of Nature’s Thermostat
Figure 3-27

68
Effects of Human Activities on Carbon Cycle
We alter the carbon cycle by adding excess CO2 to the atmosphere through: Burning fossil fuels. Clearing vegetation faster than it is replaced. Figure 3-28

69
(billion metric tons of carbon equivalent)
High projection Low projection (billion metric tons of carbon equivalent) CO2 emissions from fossil fuels Figure 3.28 Natural capital degradation: human interference in the global carbon cycle from carbon dioxide emissions when fossil fuels are burned and forests are cleared, 1850 to 2006 and projections to 2030 (dashed lines). (Data from UN Environment Programme, British Petroleum, International Energy Agency, and U.S. Department of Energy) Year Fig. 3-28, p. 74
 CO2 emissions from fossil fuels. Figure Natural capital degradation: human interference in the global carbon cycle from carbon dioxide emissions when fossil fuels are burned and forests are cleared, 1850 to 2006 and projections to 2030 (dashed lines). (Data from UN Environment Programme, British Petroleum, International Energy Agency, and U.S. Department of Energy) Year. Fig. 3-28, p. 74.")
70
The Nitrogen Cycle: Bacteria in Action
Next

71
Excretion, death, decomposition
Gaseous nitrogen (N2) in atmosphere Food webs on land Nitrogen fixation Fertilizers Uptake by autotrophs Figure 3.29 Natural capital: simplified model of the nitrogen cycle in a terrestrial ecosystem. Nitrogen reservoirs are shown as boxes; processes changing one form of nitrogen to another are shown in unboxed print. QUESTION: What are three ways in which your lifestyle directly or indirectly affects the nitrogen cycle? (Adapted from Cecie Starr, Biology: Today and Tomorrow, Brooks/Cole © 2005) Loss by denitrification Excretion, death, decomposition Uptake by autotrophs Ammonia, ammonium in soil Nitrogen-rich wastes, remains in soil Nitrate in soil Nitrification Ammonification Loss by leaching Loss by leaching Nitrite in soil Nitrification Fig. 3-29, p. 75
 in atmosphere. Food webs on land. Nitrogen fixation. Fertilizers. Uptake by autotrophs. Figure Natural capital: simplified model of the nitrogen cycle in a terrestrial ecosystem. Nitrogen reservoirs are shown as boxes; processes changing one form of nitrogen to another are shown in unboxed print. QUESTION: What are three ways in which your lifestyle directly or indirectly affects the nitrogen cycle (Adapted from Cecie Starr, Biology: Today and Tomorrow, Brooks/Cole © 2005) Loss by. denitrification. Excretion, death, decomposition. Uptake by autotrophs. Ammonia, ammonium in soil. Nitrogen-rich wastes, remains in soil. Nitrate in soil. Nitrification. Ammonification. Loss by. leaching. Loss by. leaching. Nitrite in soil. Nitrification. Fig. 3-29, p. 75.")
72
Effects of Human Activities on the Nitrogen Cycle
We alter the nitrogen cycle by: Adding gases that contribute to acid rain. Adding nitrous oxide to the atmosphere through farming practices which can warm the atmosphere and deplete ozone. Contaminating ground water from nitrate ions in inorganic fertilizers. Releasing nitrogen into the troposphere through deforestation.

73
Effects of Human Activities on the Nitrogen Cycle
Human activities such as production of fertilizers now fix more nitrogen than all natural sources combined. Figure 3-30

74
Global nitrogen (N) fixation
Nitrogen fixation by natural processes Global nitrogen (N) fixation (trillion grams) Figure 3.30 Natural capital degradation: human interference in the global nitrogen cycle. Human activities such as production of fertilizers now fix more nitrogen than all natural sources combined. (Data from UN Environment Programme, UN Food and Agriculture Organization, and U.S. Department of Agriculture) Nitrogen fixation by human processes Year Fig. 3-30, p. 76
 fixation. (trillion grams) Figure Natural capital degradation: human interference in the global nitrogen cycle. Human activities such as production of fertilizers now fix more nitrogen than all natural sources combined. (Data from UN Environment Programme, UN Food and Agriculture Organization, and U.S. Department of Agriculture) Nitrogen fixation by human processes. Year. Fig. 3-30, p. 76.")
75
The Phosphorous Cycle Figure 3-31

76
mining Fertilizer excretion Guano agriculture weathering uptake by
autotrophs uptake by autotrophs leaching, runoff Marine Food Webs Dissolved in Ocean Water Dissolved in Soil Water, Lakes, Rivers Land Food Webs death, decomposition death, decomposition Figure 3.31 Natural capital: simplified model of the phosphorus cycle. Phosphorus reservoirs are shown as boxes; processes that change one form of phosphorus to another are shown in unboxed print. QUESTION: What are three ways in which your lifestyle directly or indirectly affects the phosphorus cycle? (From Cecie Starr and Ralph Taggart, Biology: The Unity and Diversity of Life, 9th ed., Belmont, Calif.: Wadsworth © 2001) weathering sedimentation settling out uplifting over geologic time Marine Sediments Rocks Fig. 3-31, p. 77
 weathering. sedimentation. settling out. uplifting over. geologic time. Marine Sediments. Rocks. Fig. 3-31, p. 77.")
77
Effects of Human Activities on the Phosphorous Cycle
We remove large amounts of phosphate from the earth to make fertilizer. It has been estimated that there is about 50 years of guano and phosphate rock remaining at current rates of removal by humans We reduce phosphorous in tropical soils by clearing forests. We add excess phosphates to aquatic systems from runoff of animal wastes and fertilizers.

78
The Sulfur Cycle Figure 3-32

79
Acidic fog and precipitation
Water Sulfur trioxide Sulfuric acid Acidic fog and precipitation Ammonia Ammonium sulfate Oxygen Sulfur dioxide Hydrogen sulfide Plants Dimethyl sulfide Volcano Industries Animals Ocean Figure 3.32 Natural capital: simplified model of the sulfur cycle. The movement of sulfur compounds in living organisms is shown in green, blue in aquatic systems, and orange in the atmosphere. QUESTION: What are three ways in which your lifestyle directly or indirectly affects the sulfur cycle? Sulfate salts Metallic sulfide deposits Decaying matter Sulfur Hydrogen sulfide Fig. 3-32, p. 78

80
Effects of Human Activities on the Sulfur Cycle
We add sulfur dioxide to the atmosphere by: Burning coal and oil Refining sulfur containing petroleum. Convert sulfur-containing metallic ores into free metals such as copper, lead, and zinc releasing sulfur dioxide into the environment.

81
The Gaia Hypothesis: Is the Earth Alive?
Some have proposed that the earth’s various forms of life control or at least influence its chemical cycles and other earth-sustaining processes. The strong Gaia hypothesis: life controls the earth’s life-sustaining processes. The weak Gaia hypothesis: life influences the earth’s life-sustaining processes.

82
HOW DO ECOLOGISTS LEARN ABOUT ECOSYSTEMS?
Field Research- Going “into the field” Measuring and/or observations out in nature Usually Controlled experiments e.g. Hubbard Brooks Rarely Lab Research Controlled indoor & outdoor chambers Systems Analysis/Modelling Feedback loops mathematically programmed

83
Remote Sensing & GIS Ecologist go into ecosystems to observe, but also use remote sensors on aircraft and satellites to collect data and analyze geographic data in large databases. Geographic Information Systems (GIS) Remote Sensing
 Remote Sensing.")
84
Remote Sensing

85
Remote Sensing

86
The effect of building roads in a rainforest…
Remote Sensing The effect of building roads in a rainforest…

87
Geographic Information Systems (GIS)
A GIS organizes, stores, and analyzes complex data collected over broad geographic areas. Allows the simultaneous overlay of many layers of data. Next

88
USDA Forest Service Private owner 1 Habitat type
Critical nesting site locations USDA Forest Service USDA Forest Service Private owner 1 Private owner 2 Topography Habitat type Forest Wetland Figure 3.33 Geographic information systems (GISs) provide the computer technology for organizing, storing, and analyzing complex data collected over broad geographic areas. They enable scientists to overlay many layers of data (such as soils, topography, distribution of endangered populations, and land protection status). Lake Grassland Real world Fig. 3-33, p. 79
 provide the computer technology for organizing, storing, and analyzing complex data collected over broad geographic areas. They enable scientists to overlay many layers of data (such as soils, topography, distribution of endangered populations, and land protection status). Lake. Grassland. Real world. Fig. 3-33, p. 79.")
89
Systems Analysis Ecologists develop mathematical and other models to simulate the behavior of ecosystems. Figure 3-34

90
Importance of Baseline Ecological Data
We need baseline data on the world’s ecosystems so we can see how they are changing and develop effective strategies for preventing or slowing their degradation. Scientists have less than half of the basic ecological data needed to evaluate the status of ecosystems in the United Sates (Heinz Foundation 2002; Millennium Assessment 2005).
.")
91
BIODIVERSITY Figure 3-15

Similar presentations


