Download presentation
Presentation is loading. Please wait.

1
AP Statistics Section 8.1: The Binomial Distribution

2
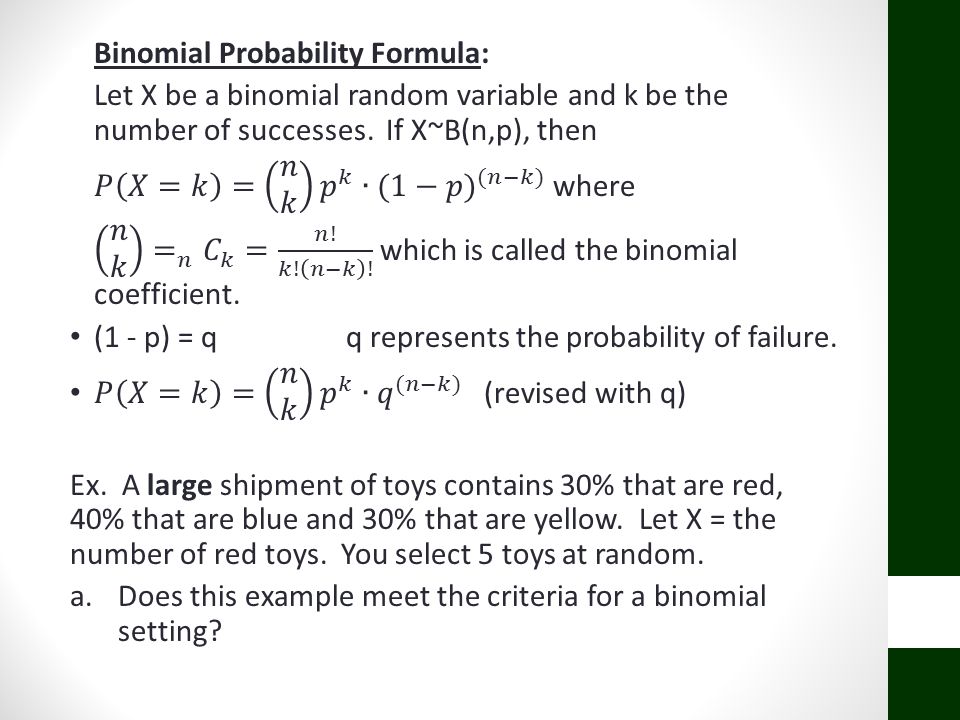
Objective: To be able to understand and calculate binomial probabilities. Criteria for a Binomial Random Variable: 1.Each observation can be classified as a success or failure. 2.n is the number of trials and n is fixed. 3.p is the probability of success and p is fixed. 4.The observations are independent. If data are produced in a binomial setting and X = the number of successes, then X is called a binomial random variable. The binomial probability distribution is as follows: 012…n … …1

3
Points: A binomial random variable is always discrete. To graph use a probability histogram. Notation: X~B(n,p) When the population > 10n (sample size) and the sample is selected without replacement we have an approximate binomial distribution. It is approximate because the condition of independence is violated. Since the effect is minimal, we can still use the binomial formula for calculations. Ex. Let p = 0.3, Population (N) = 50,000, n = 5
 When the population > 10n (sample size) and the sample is selected without replacement we have an approximate binomial distribution. It is approximate because the condition of independence is violated. Since the effect is minimal, we can still use the binomial formula for calculations. Ex. Let p = 0.3, Population (N) = 50,000, n = 5.")
7
Ex. 7 couples buy new homes. It is known that in this large community 24% of new homes are built with electric heat. Let X = the number that choose electric heat. Find the probability that 3 couples choose electric heat. (show the formula that you would use) Find the probability that at most 1 couple chooses electric heat. Find the probability that at least 3 couples choose electric heat. Find the probability that more than 3 couples choose electric heat.
 Find the probability that at most 1 couple chooses electric heat. Find the probability that at least 3 couples choose electric heat. Find the probability that more than 3 couples choose electric heat..")
10
b.Using the Normal Approximation, find the P(X < 70). Ex. Suppose from previous exit polls it is known that the probability that a voter will choose candidate A is 0.56. In an upcoming election, you plan on asking 1000 randomly selected voters who they will vote for. Using a Normal Approximation, find the probability that between 501 and 550 voters inclusive will vote for candidate A.

11
(OPTIONAL) Binomial Simulation: Methods: 1.The book method: Use randbin(1, p, n). This will choose the number 1 (for success) with probability p and 0 (for failure) with probability q. This emphasizes the binomial philosophy of success and failure. Then you must sum the 1s to arrive at the total number of successes. 2.Recommended method: Use randbin(n, p, number of simulations). This will give you the number of successes in n trials with a probability of success of p. It will do this for as many simulations as desired. 3.Use the methods learned in chapter 5.
 with probability p and 0 (for failure) with probability q. This emphasizes the binomial philosophy of success and failure. Then you must sum the 1s to arrive at the total number of successes. 2.Recommended method: Use randbin(n, p, number of simulations). This will give you the number of successes in n trials with a probability of success of p. It will do this for as many simulations as desired. 3.Use the methods learned in chapter 5..")
12
Ex. In the Hershey Kiss activity that we did in chapter 6, we found that approximately 30% of the time a Hershey Kiss lands point up. Suppose you flip a kiss 100 times. How likely is it that the kiss to lands point up more than 35 times? a.Use simulation to determine an approximate answer. b.Use the binomial formula to find the exact answer. c.Use the Normal Approximation to arrive at an approximate answer.

Similar presentations


 * Number of trials,>")


 THE BINOMIAL DISTRIBUTION (BINOMIAL FORMULAS)>")


