Download presentation
Presentation is loading. Please wait.

1
COUNTY HEALTH RANKINGS & ROADMAPS: MOVING FROM DATA TO ACTION Julie A. Willems Van Dijk RN, PhD Deputy Director, County Health Roadmaps University of Wisconsin Population Health Institute June 14, 2012

2
2 www.countyhealthrankings.org ACKNOWLEDGEMENTS ‣ Wisconsin County Health Rankings & Roadmaps Team – Including Patrick Remington, Bridget Catlin, David Kindig, Amanda Jovaag, Angela Russell ‣ Robert Wood Johnson Foundation – Including Abbey Cofsky, Brenda Henry, Michelle Larkin, Jim Marks, Joe Marx ‣ Our Partners – Including Burness Communications, Community Catalyst, United Way Worldwide, ASTHO, NACCHO, NNPHI, Dartmouth Institute, CDC, NCHS

3
3 www.countyhealthrankings.org 3 ‣ Why Rankings? ‣ Exploring the County Health Rankings ‣ Moving to Action ‣ Discussion TODAY’S OUTLINE

4
4 www.countyhealthrankings.org RANKINGS ARE EVERYWHERE

5
5 www.countyhealthrankings.org WHY RANKINGS? Rankings simplify complex data Rankings serve as a hook The media will cover Rankings Rankings add context

6
6 www.countyhealthrankings.org RANKINGS ARE THE ENTRY POINT, NOT THE END POINT!

7
7 www.countyhealthrankings.org LOGIC BEHIND THE RANKINGS

8
8 www.countyhealthrankings.org Tobacco use HEALTH BEHAVIORS (30%) Diet & exercise Alcohol use Sexual activity CLINICAL CARE (20%) Access to care Quality of care SOCIAL & ECONOMIC FACTORS (40%) Education Employment Income Family & social support Community safety PHYSICAL ENVIRONMENT (10%) Environmental quality Built environment HEALTH OUTCOMES MORTALITY (LENGTH OF LIFE): 50% MORBIDITY (QUALITY OF LIFE): 50% HEALTH FACTORS POLICIES & PROGRAMS County Health Rankings model © 2012 UWPHI
 Diet & exercise Alcohol use Sexual activity CLINICAL CARE (20%) Access to care Quality of care SOCIAL & ECONOMIC FACTORS (40%) Education Employment Income Family & social support Community safety PHYSICAL ENVIRONMENT (10%) Environmental quality Built environment HEALTH OUTCOMES MORTALITY (LENGTH OF LIFE): 50% MORBIDITY (QUALITY OF LIFE): 50% HEALTH FACTORS POLICIES & PROGRAMS County Health Rankings model © 2012 UWPHI")
9
9 www.countyhealthrankings.org TWO VIEWPOINTS Today’s Health Health Outcomes Tomorrow’s Health Health Factors 9

10
10 www.countyhealthrankings.org HOW ARE MEASURES SELECTED? Reflect important aspects of population health that can be improved Valid, reliable, recognized and used by others Available at the county-level Available for free or low cost As up-to-date as possible Fewer measures better than more

11
11 www.countyhealthrankings.org HEALTH OUTCOMES Source: Calibri 11pt.

12
12 www.countyhealthrankings.org HEALTH BEHAVIORS

13
13 www.countyhealthrankings.org CLINICAL CARE

14
14 www.countyhealthrankings.org SOCIAL & ECONOMIC FACTORS

15
15 www.countyhealthrankings.org PHYSICAL ENVIRONMENT

16
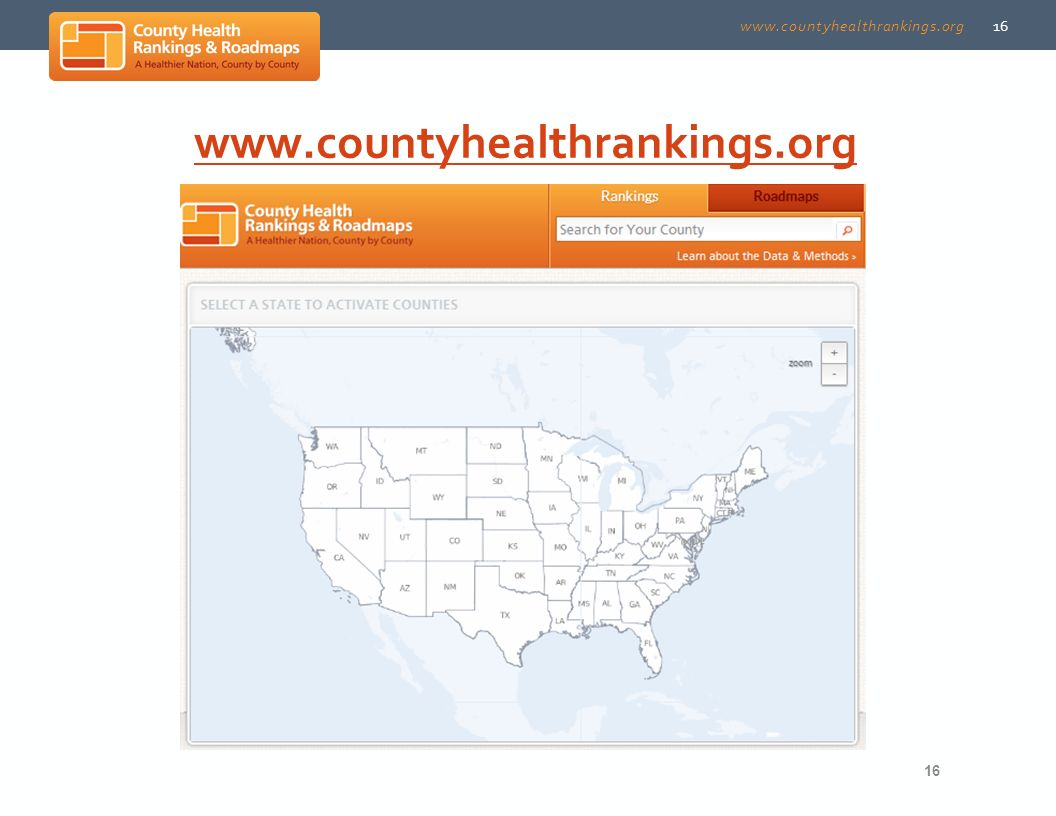
16 www.countyhealthrankings.org 16
17
17 www.countyhealthrankings.org NEW HAMPSHIRE HEALTH OUTCOMES

18
18 www.countyhealthrankings.org NEW HAMPSHIRE HEALTH FACTORS

19
19 www.countyhealthrankings.org COOS COUNTY HEALTH OUTCOMES

20
20 www.countyhealthrankings.org COOS COUNTY HEALTH FACTORS HEALTH BEHAVIORS

21
21 www.countyhealthrankings.org COOS COUNTY HEALTH FACTORS CLINICAL CARE

22
22 www.countyhealthrankings.org LAFAYETTE PARISH HEALTH FACTORS SOCIAL & ECONOMIC FACTORS

23
23 www.countyhealthrankings.org COOS COUNTY HEALTH FACTORS PHYSICAL ENVIRONMENT

24
24 www.countyhealthrankings.org

25
25 www.countyhealthrankings.org

26
26 www.countyhealthrankings.org KANSAS 26

27
27 www.countyhealthrankings.org MISSISSIPPI

28
28 www.countyhealthrankings.org RAISE AWARENESS IN YOUR COMMUNITY ‣ Annual checkup of your parish’s health (Just like an annual doctor’s visit) ‣ Where we live matters to our health ‣ There are great disparities in health based on where we live ‣ Much of what influences health happens outside the doctor’s office ‣ Health is everyone’s business & we must all work together.
 ‣ Where we live matters to our health ‣ There are great disparities in health based on where we live ‣ Much of what influences health happens outside the doctor’s office ‣ Health is everyone’s business & we must all work together.")
29
29 www.countyhealthrankings.org www.countyhealthroadmaps.org

30
30 www.countyhealthrankings.org

31
31 www.countyhealthrankings.org

32
32 www.countyhealthrankings.org

33
33 www.countyhealthrankings.org

34
34 www.countyhealthrankings.org TAKE ACTION WEBINAR SERIES Action StepWebinar Dates Work Together Work Together: In-depth May 8 May 22 Assess Assess: In-depth June 12 June 26 Focus Focus: In-depth July 10 July 24 Choose Choose: In-depth Aug. 14 Aug. 28 Act Act: In-depth Sept. 11 Sept. 25 Evaluate Evaluate: In-depth Oct. 9 Oct. 23

35
35 www.countyhealthrankings.org HTTP://WHATWORKSFORHEALTH.WISC.EDU/

36
36 www.countyhealthrankings.org Taxes, Clean Indoor Air Policies Menu labeling, School Food Policies Reduce alcohol outlet density Partner referral services Work force development Minimum wage, Paid family/medical leave Expand early childhood programs Nurse home visiting programs Zoning/incentives for mixed-use development Reducing bus emissions Pedestrian/cycling in master plans Coverage, medical homes EHRs, Public Reporting, Payment Reform Tobacco use HEALTH BEHAVIORS (30%) Diet & exercise Alcohol use Sexual activity CLINICAL CARE (20%) Access to care Quality of care SOCIAL & ECONOMIC FACTORS (40%) Education Employment Income Family & social support Community safety PHYSICAL ENVIRONMENT (10%) Environmental quality Built environment MORTALITY (LENGTH OF LIFE): 50% MORBIDITY (QUALITY OF LIFE): 50% HEALTH OUTCOMES HEALTH FACTORS POLICIES & PROGRAMS
 Diet & exercise Alcohol use Sexual activity CLINICAL CARE (20%) Access to care Quality of care SOCIAL & ECONOMIC FACTORS (40%) Education Employment Income Family & social support Community safety PHYSICAL ENVIRONMENT (10%) Environmental quality Built environment MORTALITY (LENGTH OF LIFE): 50% MORBIDITY (QUALITY OF LIFE): 50% HEALTH OUTCOMES HEALTH FACTORS POLICIES & PROGRAMS")
37
37 www.countyhealthrankings.org STAY CONNECTED ‣ e-Newsletter: chr@match.wisc.edu ‣ Like us on Facebook http://www.facebook.com/CountyHealthRankings ‣ Follow us on Twitter @CHRankings

38
38 www.countyhealthrankings.org DISCUSSION Julie Willems Van Dijk RN PhD Deputy Director, County Health Roadmaps University of Wisconsin Population Health Institute 608-263-6731 willemsvandi@wisc.edu

Similar presentations


