Download presentation
Presentation is loading. Please wait.

2
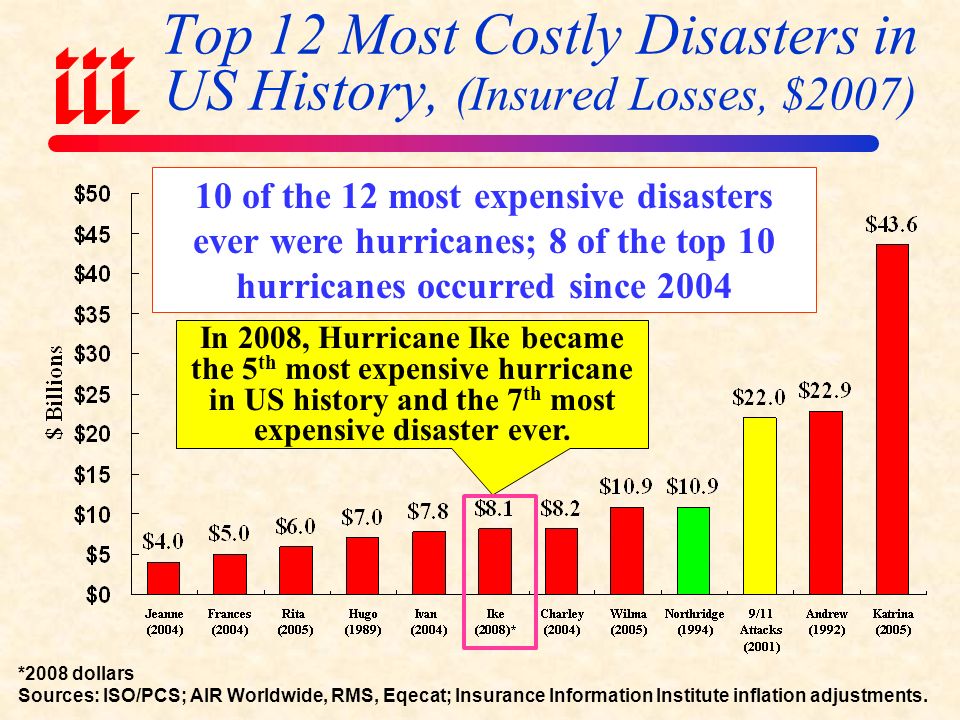
Top 12 Most Costly Disasters in US History, (Insured Losses, $2007) *2008 dollars Sources: ISO/PCS; AIR Worldwide, RMS, Eqecat; Insurance Information Institute inflation adjustments. 10 of the 12 most expensive disasters ever were hurricanes; 8 of the top 10 hurricanes occurred since 2004 In 2008, Hurricane Ike became the 5 th most expensive hurricane in US history and the 7 th most expensive disaster ever.

3
Insured Losses from Top 10 Hurricanes Since 1900 & Katrina Adjusted for Inflation, Growth in Coastal Properties, Real Growth in Property Values & Increased Property Insurance Coverage The p/c insurance industry will likely experience a $20B+ event approximately every 10- 12 years, on average—mostly associated with hurricanes *ISO/PCS estimate as of June 8, 2006. Source: Hurricane Katrina: Analysis of the Impact on the Insurance Industry, Tillinghast, October 2005; Insurance Info. Institute. (Billions of 2005 Dollars) Great Miami Hurricane Galveston Storm
 Great Miami Hurricane Galveston Storm.")
4
Total Value of Insured Coastal Exposure (2004, $ Billions) Source: AIR Worldwide Northeast states have significant exposure. In 2004 Florida had more insured coastal exposure—at nearly $2 trillion than any other state. Future “Mega-Losses” are UNAVOIDABLE.

5
Total Value of Insured Coastal Exposure (2007, $ Billions) Source: AIR Worldwide In 2007, Florida still ranked as the #1 most exposed state to hurricane loss, with $2.459 trillion exposure, an increase of $522B or 27% from $1.937 trillion in 2004. The insured value of all coastal property was $8.9 trillion in 2007, up 24% from $7.2 trillion in 2004. $522B increase since 2004, up 27%

6
Underwriting Gain (Loss) in Florida Homeowners Insurance, 1992-2007E* *2007 estimate by Insurance Information Inst. based on historical loss, expense and premium data for FL. **Does not include Citizens Property Insurance Corporation results. $ Billions Florida’s homeowners insurance market produces small/modest profits in most years and enormous losses in others Private Insurers**

7
Cumulative Underwriting Gain (Loss) in Florida Homeowners Insurance, 1992-2007E* $ Billions It took insurers 11 years (1993- 2003) to erase the UW loss associated with Andrew, but the 4 hurricanes of 2004 erased the prior 7 years of profits & 2005 deepened the hole. Regulator under US law has duty to allow rates that are “fair,” “not excessive” and “not unduly discriminatory.” Reality is that regulators in CAT-prone states suppress rates. *2007 estimate by Insurance Information Inst. based on historical loss, expense and premium data for FL. **Does not include Citizens Property Insurance Corporation results. Private Insurers**

8
CAPITAL & CAPACITY CONSIDERATIONS: INSURERS MUST PUT LARGE AMOUNTS OF CAPITAL AT RISK TO OFFER INSURANCE IN FLORIDA

9
Estimated Cumulative New Insurance Capital Required to Support Growth in FL Homeownership, 2005-2015* *Estimate assumes 1:1 premium-to-surplus ratio and continuation of CAGR in direct premiums written of 11% (actual rate for period 1996-2003). Source: Insurance Information Institute Florida may need to attract more than $9 billion in new capital over the next decade, assuming recent demographic trends continue.

10
Are Coastal Development Patterns Economically Rational?

11
Florida for Sale: 24/7/365 Ft. Lauderdale West Palm Miami Beach

12
New Condo Construction in South Miami Beach, 2007-2009 Number of New Developments: 15 Number of Individual Units: 2,111 Avg. Price of Cheapest Unit: $940,333 Avg. Price of Most Expensive Unit: $6,460,000 Range: $395,000 - $16,000,000 Overall Average Price per Unit: $3,700,167* Aggregate Property Value: At least $6 Billion *Based on average of high/low value for each of the 15 developments Source: Insurance Information Institute from www.miamicondolifestyle.com accessed April 5, 2007.www.miamicondolifestyle.com

13
Great Miami Hurricane of 1926: Hurricane Damage Adjusted for Inflation, Growth in Coastal Properties, Real Growth in Property Values* Repeat of Great Miami Hurricane of 1926 could cause $500B in damage by 2020 given current demographic trends *Includes damage form wind and storm surge but generally excludes inland flooding. Source: Roger Pielke and Christopher Landsea, December 2005; Insurance Info. Institute. (Billions of 2004 Dollars) Track of 1926 storm
 Track of 1926 storm.")
14
Insurance Information Institute On-Line If you would like a copy of this presentation, please give me your business card with e-mail address

Similar presentations


>")


INSURANCE Richard J. Murnane RPI/BIOS, 16 Jjune 2011 Researcher.>")


