Download presentation
Presentation is loading. Please wait.

1
Innovation for Growth – i4g Universities are portfolios of (largely heterogeneous) disciplines. Further problems in university rankings Warsaw, 16 May 2013 Andrea Bonaccorsi University of Pisa and ANVUR I4G Expert group, European Commission In collaboration with Tindaro Cicero, University of Roma Tor Vergata Luca Secondi, Uninettuno Enza Setteducati, ANVUR

2
Debate on university rankings in the European context Largely used by governments and decision makers but also criticized: -biased towards large and established universities -biased towards medicine and science -non-neutral with respect to disciplinary specialization (broad fields vs niches) -large impact of few top journals -correlation among individual components of composite indicators -single source of bibliometric data (ISI Thomson) -no statistical representativeness of surveys -monodimensionality of rankings
 -large impact of few top journals -correlation among individual components of composite indicators -single source of bibliometric data (ISI Thomson) -no statistical representativeness of surveys -monodimensionality of rankings")
3
Two lines of action Multi-dimensional ranking -combine research with other dimensions of university activity -survey-based -customized rankings based on the selection of indicators -large effort in progress Multi-disciplinary research benchmarking -only research -but transparent in the disciplinary mix -different rankings available depending on the choice of weights -only experimental

4
Multi-disciplinary research benchmarking -Use alternative bibliometric data source -Allow disaggregation by scientific discipline at fine-grained level (i.e. individual scientific fields) -Build up measures of overall competitiveness as bottom up aggregation of performance in individual disciplines -Combine quantity (= volume of publications), impact (= number of citations ) and quality (= share of publications in high quality journals) -Allow benchmarking of individual universities -Transparency in weights -Allow fine tuning of weights in composite indicators -Allow multi-dimensionality as a construction of several, alternative, non-commensurable measures
 -Build up measures of overall competitiveness as bottom up aggregation of performance in individual disciplines -Combine quantity (= volume of publications), impact (= number of citations ) and quality (= share of publications in high quality journals) -Allow benchmarking of individual universities -Transparency in weights -Allow fine tuning of weights in composite indicators -Allow multi-dimensionality as a construction of several, alternative, non-commensurable measures.")
5
Global Research Benchmarking System Over 24,000 source titles of types Journal, Conference Proceedings, and Book Series from Elsevier's Scopus database. Period covered 2007-2010 (4 year window) Over 250 disciplinary and interdisciplinary subject areas 1337 universities from Asia-Pacific, North America (USA and Canada) and Europe. New release 2013 covering the 2008-2011 period just announced! www.researchbenchmarking.org
 Over 250 disciplinary and interdisciplinary subject areas 1337 universities from Asia-Pacific, North America (USA and Canada) and Europe. New release 2013 covering the period just announced.")
6
Indicators available at GRBS For each subject area – Number of publications – Percentage of publications in top source titles » top 10% journals » top 25% journals – Number of citations – Percentage of citations from top source titles » top 10% journals » top 25% journals – H-index 2007-2010 – Percentage publications from international collaborations – Percentage citations to publications from international collaborations Top source titles are determined by their SNIP values

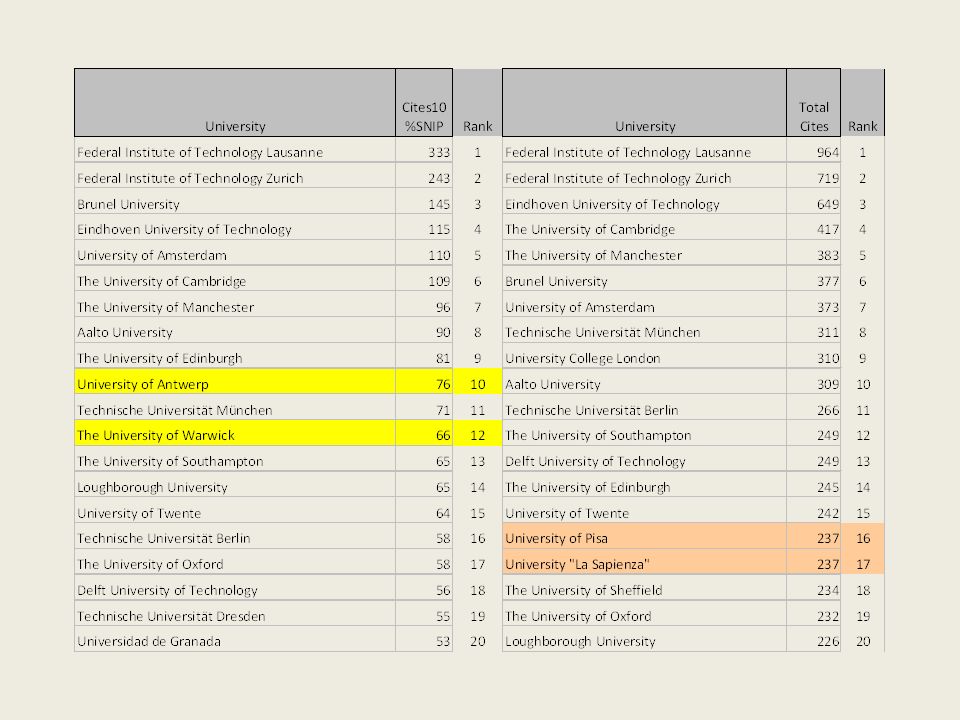
7
Using different indicators may lead to different rankings Example: Information systems Our metrics Number of cites in top 10% SNIP vs. Total number of cites

10
Construction of a composite indicator Indicators chosen to provide a balanced measure of key dimensions of research performance: output, scholarly impact, volume, quality. – Number of publications – Percentage publications in top source titles » top 10% journals » top 25% journals – Number of citations – 4 year H-index – Percentage of citations from top source titles » top 10% journals » top 25% journals

11
Composite indicator Each of the 7 dimensions is weighted equally This composite indicator gives large importance to quality indicators expressed in percentage, and then independent on absolute size. This is a major departure, among many other substantive differences, from existing rankings that implicitly place weight to absolute size of universities. At the same time, given the correlation between percentages of publications and citations in the top 10% and 25%, respectively, this measure gives visibility to excellence as measured by the ability to compete for good journals.

12
Remarks Two definitions of excellence- top 10% and top 30% Ranking of universities is done by counting the number of disciplinary fields in which a university is present in the top 10% or 30% Unweighted Weighted Caveats Size matters Threshold at 50 publications per field in 4 years No visibility of small but excellent institutions (e.g. Ecole Normale in France, Scuola Normale or SISSA in Italy) Language matters (English language bias) Correlation between 10% and 25% SNIP indicators (publications and citations) No humanities and social sciences Granularity of classification of disciplines may be different across fields No Public Research Organizations- data should not be interpreted as an evaluation of national public research systems No national Science Academies
 Language matters (English language bias) Correlation between 10% and 25% SNIP indicators (publications and citations) No humanities and social sciences Granularity of classification of disciplines may be different across fields No Public Research Organizations- data should not be interpreted as an evaluation of national public research systems No national Science Academies.")
13
Region Global players (>10) Moderate players (3-9) Niche players (1-2) Total number of universi ties in top 10% Total number of fields in top 10% % of fields by region North America 1323336941250,9 Europe317436318022,2 Asia715295121726,8 Total2355104182809100,0 Distribution of universities by number of fields (unweighted) in top 10%, by region
 Moderate players (3-9) Niche players (1-2) Total number of universi ties in top 10% Total number of fields in top 10% % of fields by region North America ,9 Europe ,2 Asia ,8 Total ,0 Distribution of universities by number of fields (unweighted) in top 10%, by region")
14
Country Number of universities in top 10% Number of fields United Kingdom 1965 Netherlands 945 Switzerland 316 Sweden 514 Germany 811 Denmark 28 France 56 Belgium 36 Italy 33 Norway 33 Finland 11 Portugal 11 Spain 11 Total 63180 Number of universities in top 10% and number of fields by country. EU 27 + Norway and Switzerland

15
Region Global players (>10) Moderate players (3-9) Niche players (1-2) Total number of universities in top 30% Total number of fields in top 30% % of fields North America 915047188406447% Europe 82 109273286333% Asia Pacific 505774181176520% Total 2231892306428692100% Distribution of universities by number of fields (unweighted) in top 30%, by region
 Moderate players (3-9) Niche players (1-2) Total number of universities in top 30% Total number of fields in top 30% % of fields North America % Europe % Asia Pacific % Total % Distribution of universities by number of fields (unweighted) in top 30%, by region")
16
Country Number of universities in top 30% Share_univ Number of fields in top 30% Share_field United Kingdom 530.651710.90 Netherlands 131.001480.79 Switzerland 90.821010.62 Sweden 110.61990.59 Germany 430.61930.53 Denmark 50.63800.53 Belgium 70.70790.48 France 260.43670.46 Italy 290.50670.41 Spain 300.64490.31 Finland 70.70480.33 Norway 70.58280.21 Greece 80.50270.19 Austria 60.38240.18 Portugal 70.54230.18 Ireland 40.50120.13 Czech Republic 20.1130.03 Poland 30.0620.02 Estonia 10.3310.02 Romania 10.0610.03 Slovenia 10.3310.01 Total 2730.5011240.40 Scientific excellence at top 30% by European country Source: Innovation 4 Growth (2013) based on Global Research Benchmarking
 based on Global Research Benchmarking")
Similar presentations


 European Commission MPHASIS Mutual Progress on Homelessness through Advancing and Strengthening Information Systems.>")


 “European R&D Benchmarking (2002)” Science, Technology and Innovation Policy Student Presentations Students: Miguel.>")


 Study A World Health Organization Cross- National.>")


