Download presentation
Presentation is loading. Please wait.

1
Characterizing Phase Transitions in a Model of Neutral Evolutionary Dynamics
Adam David Scott Department of Physics & Astronomy University of Missouri at St. Louis APS March Meeting – Baltimore, MD 18 March 2013

2
Acknowledgements Dr. Sonya Bahar Dawn King Dr. Nevena Marić
McDonnell Foundation Complex Systems Grant UMSL Department of Physics & Astronomy

3
Obtaining critical exponents for each
Model Phase transitions Evidence for two separate behaviors Obtaining critical exponents for each

4
Model ONLY phenotypic evolution Asexual
No genetics & no physical space 2D Continuous with absorbing boundaries Asexual Branching & coalescing random walks Reaction-diffusion process Mutability, μ Maximum possible offspring mutation from parent Control parameter Clustering Dawn’s: Random death percentage for each organism Control parameter is random death percentage THIS: Random death percentage of population Control parameter is mutability

5
Model: Clustering Phenetic species Cluster seeds
Speciation by phenotypes Cluster seeds Reference Nearest neighbor Second nearest neighbor Closed sets of cluster seeds

6
Generations Mutability Scott et al. (submitted)
")
7
Phase Transitions: Order Parameters
<Population> <Number of Clusters> 0.34 0.38 0.34 0.38 Scott et al. (submitted)
")
8
Evidence: Times to extinction

9
Evidence: Nearest Neighbor Index
Clark & Evans Average nearest neighbor distance / random expectation 0.34 0.38 Scott et al. (submitted)
")
10
Phase Transitions Temporal 2nd order non-equilibrium
Absorbing state: extinction Directed percolation Spatial 2nd order equilibrium Isotropic percolation Pick a time, change mu, does either state trap the system? Yes = non-equilibrium, No = equilibrium

11
Directed Percolation: Critical Exponents
Density scaling, ρ~ (𝑝− 𝑝 𝑐 ) −𝛽 Density decay rate, ρ~ 𝑡 −α Correlation length, ξ ~ (𝑝− 𝑝 𝑐 ) −ν Decay rate, ξ ~ 𝑡 1 𝑧 Correlation time, ξ ~ (𝑝− 𝑝 𝑐 ) −ν Need 2 for classification 𝛼= 𝛽 ν 𝑧= ν ν (Henkel, Hinrichsen, Lübeck)
 −𝛽. Density decay rate, ρ~ 𝑡 −α. Correlation length, ξ ~ (𝑝− 𝑝 𝑐 ) −ν. Decay rate, ξ ~ 𝑡 1 𝑧. Correlation time, ξ ~ (𝑝− 𝑝 𝑐 ) −ν. Need 2 for classification. 𝛼= 𝛽 ν 𝑧= ν ν. (Henkel, Hinrichsen, Lübeck)")
12
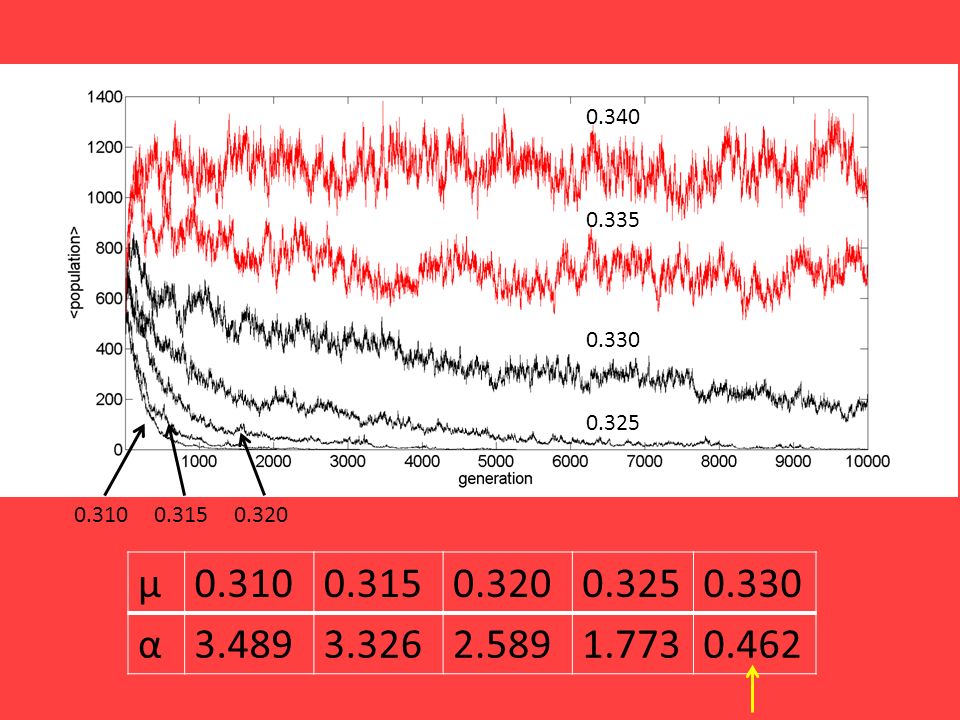
0.340 0.335 0.330 0.325 0.310 0.315 0.320 μ 0.310 0.315 0.320 0.325 0.330 α 3.489 3.326 2.589 1.773 0.462
13
Directed Percolation Density Decay Rate
This model 𝛼~0.462±0.033 Compared with others 𝛼= 𝛽 ν ~ (Hinrichsen) 2.6% 𝛼= 𝛽 ν ~ (Lauritsen) 2.4%
 2.6% 𝛼= 𝛽 ν ~ (Lauritsen) 2.4%")
14
Isotropic Percolation: Critical Exponents
Static measures Fisher exponent 𝑛 𝑠 ~ 𝑠 −𝜏 Distribution of cluster mass, ns, for size, s Cluster fractal dimension N ~ 𝐿 𝑑 𝑓 Cluster mass (N) Number of organisms in cluster Cluster diameters (L) Longest of the shortest paths Still running! (Lesne)
 Number of organisms in cluster. Cluster diameters (L) Longest of the shortest paths. Still running! (Lesne)")
15
Absorbing State Extinction
Conclusions Absorbing State Extinction Surviving Surviving Two 2nd order phase transitions Non-equilibrium (directed percolation) Equilibrium (isotropic percolation) Possibility for this behavior in real biology? First experimental directed percolation observed in 2007 for liquid crystals (Takeuchi et al.) Aggregated Spanning 𝜇~0.335 𝜇~0.38
 Equilibrium (isotropic percolation) Possibility for this behavior in real biology First experimental directed percolation observed in 2007 for liquid crystals (Takeuchi et al.) Aggregated. Spanning. 𝜇~ 𝜇~0.38.")
16
Absorbing State Extinction
Thank you! Absorbing State Extinction Surviving Surviving Aggregated Spanning 𝜇~0.335 𝜇~0.38

17
References Henkel, Hinrichsen, Lübeck, Non-Equilibrium Phase Transitions: Vol 1: Absorbing Phase Transitions, 2009 Hinrichsen, “Nonequilibrium Critical Phenomena and Phase Transitions into Absorbing States”, arXiv, 2000 Lauritsen, Sneppen, Marošová, Jensen, ”Directed percolation with an absorbing boundary”, 1997. Lesne, Renormalization Methods: Critical Phenomena, Chaos, Fractal Structures, 1998 Scott, King, Marić, Bahar, “Clustering and Phase Transitions on a Neutral Landscape”, submitted Takeuchi, Kuroda, Chaté, Sano, “Directed percolation criticality in turbulent liquid crystals”, 2007, 2009

Similar presentations


 from China Wang et al. PNAS Feb. 11, 2008.>")


