Download presentation
Presentation is loading. Please wait.

1
Potential Shellfish Aquaculture in Little Bay, New Hampshire REVISED January 18, 2012 Chris Nash and Carol Elliott NH Department of Environmental Services, Shellfish Program Chris.Nash@des.nh.govCarol.Elliott@des.nh.gov (603)-559-1509 (603)-559-1508
 (603)")
2
Why Focus on Little Bay? Great Bay Research Reserve Boundary Eelgrass Cover in Great Bay Shellfish Harvest Closures

3
Great Bay National Estuarine Research Reserve Boundary Restrictions on commercial aquaculture in the “core area” (south of the red line).
.")
5
Shellfish Harvest Closures

6
Bathymetry Suitable for Bottom Oyster Culture Mean low water to -5m 779 acres* Constraints include: –Existing farms –Eelgrass –Harvest closures –Mooring fields –Oil Spill response buoys *Mapped by R. Grizzle and K. Ward at the University of New Hampshire

7
Current Aquaculture Sites Five licensed farms (~17 acres) One upweller site 100m F&G buffer between sites
 One upweller site 100m F&G buffer between sites")
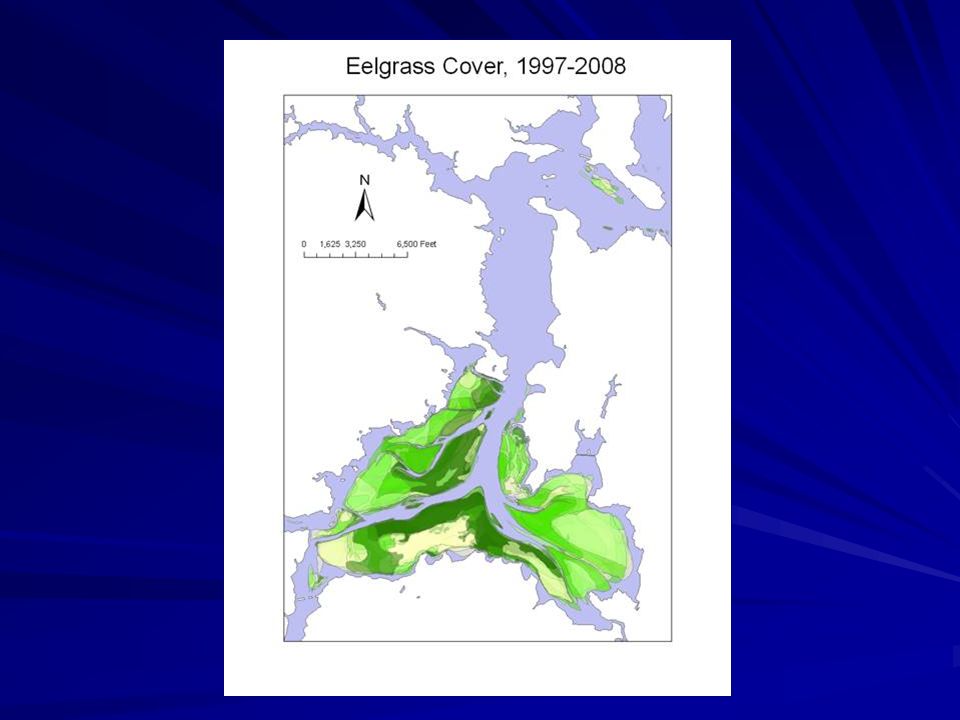
8
Eelgrass Coverage 12-Year Occurrence

10
Shellfish Areas Closed For Harvest Multiple public health risk factors –wastewater treatment facilities –marinas, mooring fields –other pollution sources

11
Flexibility With Closed Areas General Sullivan Bridge closure –temporary closure until construction Is complete –~ 35 acres Marina and mooring field areas –reduced closure zones

12
Mooring Fields No farms within an existing mooring field 150’ buffer zone –potential boat sewage risk –standard assumptions and calculations Flexibility to resize buffers

13
NHDES Spill Response Buoys 50’ buffer zone to prevent entanglements

14
Revised Potential Aquaculture Area ~389 acres eliminated ~ 17 acres in use ~ 396 acres available Maximum aquaculture area is ~413 acres

15
How Many Aquaculture Sites Fit Within This Area? Hypothetical four-acre farm 50m buffer: 14.2 acres 36 (buffered) farms 144 acres harvestable area Likely an overestimate – –depth, substrate, others Assume unidentified constraints eliminate half of the 36 farms
 farms 144 acres harvestable area Likely an overestimate – –depth, substrate, others Assume unidentified constraints eliminate half of the 36 farms.")
16
How Many Oysters? One Age Class StageAssumedMortality Oysters Per Acre At Set Out ---750,000 After First Winter 60%300,000 Second Year 30%210,000 Third Year 29%149,100

17
# Oysters on 4-Acre Farm Multiple Age Classes on Four 1-acre Subplots Typical Four-Acre Farm 18 Four-Acre Farms* Oysters 750,000 (yr 0) 300,000 (yr 1) 210,000 (yr 2) 149,100 (yr 3) 13,500,000 (yr 0) 5,400,000 (yr 1) 5,400,000 (yr 1) 3,870,000 (yr 2) 3,870,000 (yr 2) 2,683,800 (yr 3) 2,683,800 (yr 3) Total 1,409,100 oysters 25,363,800 oysters * Half of the 36 possible farms; does not include 5 existing farms (17 acres)
 300,000 (yr 1) 210,000 (yr 2) 149,100 (yr 3) 13,500,000 (yr 0) 5,400,000 (yr 1) 5,400,000 (yr 1) 3,870,000 (yr 2) 3,870,000 (yr 2) 2,683,800 (yr 3) 2,683,800 (yr 3) Total 1,409,100 oysters 25,363,800 oysters * Half of the 36 possible farms; does not include 5 existing farms (17 acres)")
18
Comparison to Historical Numbers 1993: 24,000,000 harvestable-size oysters in Great Bay 2008: 2,400,000 harvestable-size oysters in Great Bay PREP Goal: 10,000,000 harvestable-size oysters

19
Effects of Changing Farm Size Farm Size (acres) FarmDimensions 50m Buffer Footprint Max. # Possible Farms 4 450’ x 390’ 14 acres 36 3 400’ x 330’ 11 acres 62 2 350’ x 250’ 9 acres 83

20
How Many Aquaculture Sites Fit Within This Area? Hypothetical three-acre farm 50m buffer: 11 acres 62 (buffered) farms 186 acres harvestable area Likely an overestimate – –depth, substrate, others Assume unidentified constraints eliminate half of the 62 farms
 farms 186 acres harvestable area Likely an overestimate – –depth, substrate, others Assume unidentified constraints eliminate half of the 62 farms.")
21
# Oysters on 3-Acre Farm Multiple Age Classes on Four 0.75 acre Subplots Typical Three-Acre Farm 31 Three-Acre Farms* Oysters 562,500 (yr 0) 225,000 (yr 1) 157,500 (yr 2) 111,825 (yr 3) 17,437,500 (yr 0) 6,975,000 (yr 1) 6,975,000 (yr 1) 4,882,500 (yr 2) 4,882,500 (yr 2) 3,466,575 (yr 3) 3,466,575 (yr 3) Total 1,056,825 oysters 32,761,575 oysters *Half of the 62 possible farms; does not include 5 existing farms (17 acres). Estimates assume Year 0 seeding rate of 750,000 juveniles/acre.

22
How Many Aquaculture Sites Fit Within This Area? Hypothetical two-acre farm 50m buffer: 9 acres 83 (buffered) farms 166 acres harvestable area Likely an overestimate – –depth, substrate, others Assume unidentified constraints eliminate half of the 83 farms
 farms 166 acres harvestable area Likely an overestimate – –depth, substrate, others Assume unidentified constraints eliminate half of the 83 farms.")
23
# Oysters on 2-Acre Farm Multiple Age Classes on Four 0.5 acre Subplots Typical Two-Acre Farm 41 Two-Acre Farms* Oysters 375,000 (yr 0) 150,000 (yr 1) 105,000 (yr 2) 74,550 (yr 3) 74,550 (yr 3) 15,375,000 (yr 0) 15,375,000 (yr 0) 6,150,000 (yr 1) 6,150,000 (yr 1) 4,305,000 (yr 2) 4,305,000 (yr 2) 3,056,550 (yr 3) 3,056,550 (yr 3) Total 704,550 oysters 28,886,550 oysters *Half of the 83 possible farms; does not include 5 existing farms (17 acres). Estimates assume Year 0 seeding rate of 750,000 juveniles/acre.

24
Scenarios Farm Size Number of Farms Annual Oyster Production 2 acres 20 - 41 1.52 – 3.06 million 3 acres 16 – 31 1.73 - 3.47 million 4 acres 9 – 18 1.34 – 2.68 million Low-end production estimates assume ¼ of the potential farms identified are licensed. High-end production estimates assume ½ of the potential farms identified are licensed.

25
Potential Market-Sized Annual Oyster Production

26
Upweller: Preferred Conditions Salinity: 12-32 ppt Required Depth: 3–4 ft Water Temp: > 50°F Nutrients: Influx of Nutrient-Rich Water Power Source Stable Attachment

27
Assumed Production of Spat from Upwellers Assume each upweller produces 1.8 million juveniles from 2 million seed each season. Farm Size (acres) Estimated # Spat Needed per Year Estimated # Upwellers 2 7.7 - 15.4 million 5 - 9 3 8.7 - 17.4 million 5 - 10 4 6.8 - 13.5 million 4 - 8
 Estimated # Spat Needed per Year Estimated # Upwellers million million million")
28
Possible Upweller Locations Tidal Tributaries Where: –Salinity 10-34ppt –Depth > 4 ft –Power source Private residences WWTF Outfalls

29
Possible Upweller Locations Little Bay Where: –Salinity 10-34ppt –Depth > 4 ft –Power Source Marinas Private residences

Similar presentations


. Height differences in fish culture ( Slope determination) In pond culture, you must often measure the difference.>")


