Download presentation
Presentation is loading. Please wait.

2
Module 2 # 1 Pharmacodynamics
Kash Desai HSc A120

3
Drug Receptors and Pharmacodynamics (how drugs work on the body)
The action of a drug on the body, including receptor interactions, dose-response phenomena, and mechanisms of therapeutic and toxic action.

4
(how drugs work on the body)
2 Pharmacodynamics (how drugs work on the body) many drugs inhibit enzymes Enzymes control a number of metabolic processes A very common mode of action of many drugs in the patient (ACE inhibitors) in microbes (sulfas, penicillins) in cancer cells (5-FU, 6-MP) some drugs bind to: proteins (in patient, or microbes) the genome (cyclophosphamide) microtubules (vincristine)
 many drugs inhibit enzymes. Enzymes control a number of metabolic processes. A very common mode of action of many drugs. in the patient (ACE inhibitors) in microbes (sulfas, penicillins) in cancer cells (5-FU, 6-MP) some drugs bind to: proteins (in patient, or microbes) the genome (cyclophosphamide) microtubules (vincristine)")
5
Pharmacodynamics 3 most drugs act (bind) on receptors in or on cells
form tight bonds with the ligand exacting requirements (size, shape, stereospecificity) can be agonists (salbutamol), or antagonists (propranolol) receptors have signal transduction methods
 can be agonists (salbutamol), or antagonists (propranolol) receptors have signal transduction methods")
6
Drug Receptor A macromolecular component of a cell with which a drug interacts to produce a response Usually a protein

7
Types of Protein Receptors
Regulatory – change the activity of cellular enzymes Enzymes – may be inhibited or activated Transport – e.g. Na+ /K+ ATP’ase Structural – these form cell parts

8
dose response curves 5 k 1 [D] + [R] [DR] effect k -1
k1/k-1 = affinity const. k-1/k1 = dissociation const.(kd) at equilibrium: [D] x [R] x k1 = [DR] x k-1 so that: [DR] = k1 [D] [R] k-1 the lower the kd the more potent the drug
![dose response curves 5 k 1 [D] + [R] [DR] effect k -1](http://slideplayer.com/slide/7276389/24/images/8/dose+response+curves+5+%EF%81%A1+k+1+%5BD%5D+%2B+%5BR%5D+%5BDR%5D+effect+k+-1.jpg "k1/k-1 = affinity const. k-1/k1 = dissociation const.(kd) at equilibrium: [D] x [R] x k1 = [DR] x k-1. so that: [DR] = k1. [D] [R] k-1. the lower the kd the more potent the drug")
9
Drug - Receptor Binding
D + R DR Complex Affinity – measure of propensity of a drug to bind receptor; the attractiveness of drug and receptor Covalent bonds are stable and essentially irreversible Electrostatic bonds may be strong or weak, but are usually reversible Affinity

10
Drug Receptor Interaction
DR Complex Effect Efficacy (or Intrinsic Activity) – ability of a bound drug to change the receptor in a way that produces an effect; some drugs possess affinity but NOT efficacy
 – ability of a bound drug to change the receptor in a way that produces an effect; some drugs possess affinity but NOT efficacy")
11
Drug-receptor interaction
k1 Drug + Free Receptor Drug-receptor Complex D (100 - DR) k-1 DR Where: D = drug concentration DR= concentration of drug-receptor complex 100 - DR = free receptor concentration
 k-1. DR. Where: D = drug concentration. DR= concentration of drug-receptor complex DR = free receptor concentration")
12
Drug-receptor interaction
At equilibrium: [D] x [R] x k1 = [DR] x k-1 so that: [DR] = k1 [D] [R] k-1 k-1/k1 = dissociation constant (kd)
")
13
What can we learn? Ke (k1/k-1) is called the affinity constant
At equilibrium: [D] x [R] x k1 = [DR] x k-1 so that: [DR] = k1 [D] [R] k-1 k-1/k1 = dissociation constant (kd) What can we learn? Ke (k1/k-1) is called the affinity constant DR is the response; D is concentration of drug when DR = 50 percent (effect is half maximal), D (or EC50) is equal to kd or the reciprocal of the affinity constant response is a measure of efficacy drugs that have parallel dose-response curves often have the same mechanism of action
 What can we learn Ke (k1/k-1) is called the affinity constant. DR is the response; D is concentration of drug. when DR = 50 percent (effect is half maximal), D (or EC50) is equal to kd or the reciprocal of the affinity constant. response is a measure of efficacy. drugs that have parallel dose-response curves often have the same mechanism of action")
14
dose response curves-2 6 % occupancy
effect = [DR] = Emax * [D]/([D]+EC50) Concept: spare receptors
 Concept: spare receptors")
15
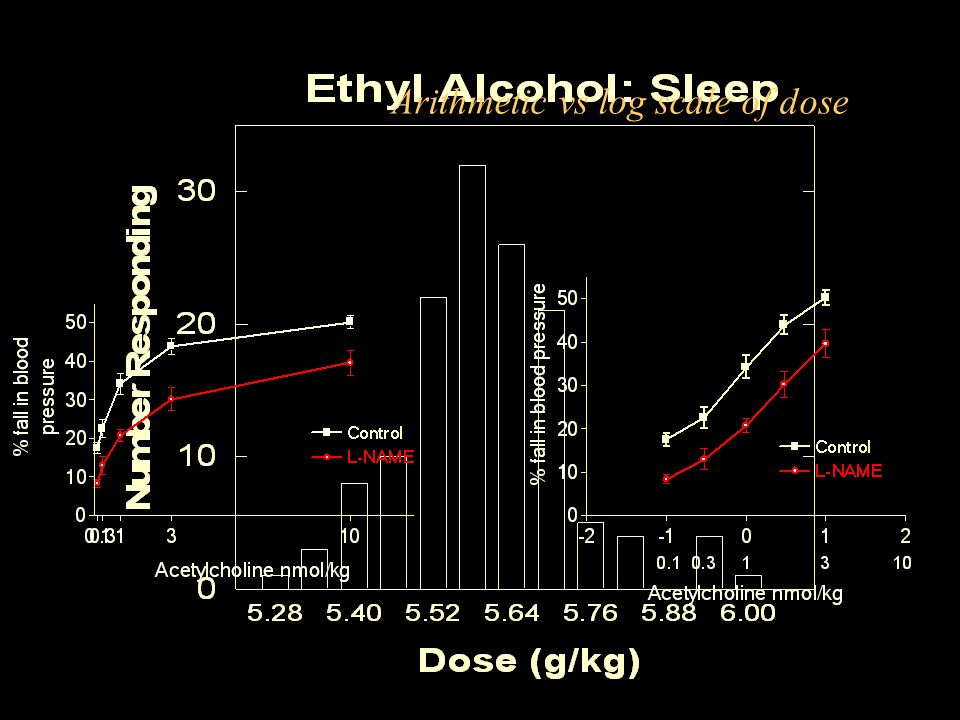
Arithmetic Dose Scale Rate of change is rapid at first and becomes progressively smaller as the dose is increased Eventually, increments in dose produce no further change in effect i.e., maximal effect for that drug is obtained Difficult to analyze mathematically

16
Log Dose Scale transforms hyperbolic curve to a sigmoid (almost a straight line) compresses dose scale proportionate doses occur at equal intervals straightens line easier to analyze mathematically

17
Arithmetic vs log scale of dose
18
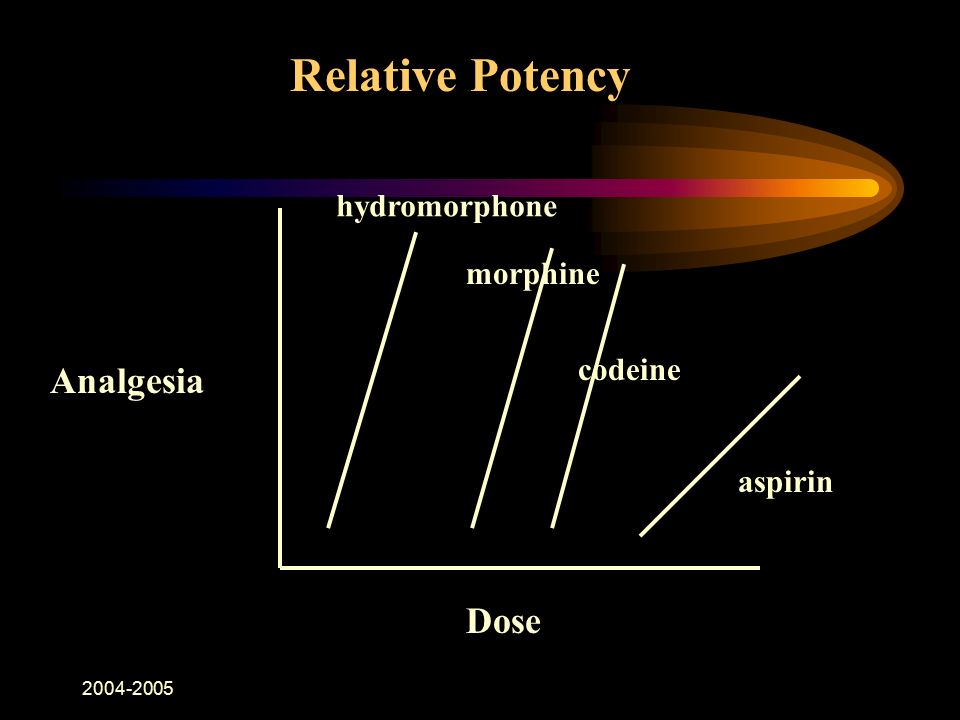
Potency Relative position of the dose-effect curve along the dose axis
Has little clinical significance for a given therapeutic effect A more potent of two drugs is not clinically superior Low potency is a disadvantage only if the dose is so large that it is awkward to administer

19
Relative Potency Analgesia Dose hydromorphone morphine codeine aspirin
20
Why are there spare receptors?
7 Why are there spare receptors? allow maximal response without total receptor occupancy – increase sensitivity of the system spare receptors can bind (and internalize) extra ligand preventing an exaggerated response if too much ligand is present The receptor theory assumes that all receptors should be occupied to produce a maximal response. In that case at half maximal effect EC50=kd. Sometimes, full effect is seen at a fractional receptor occupation
 extra ligand preventing an exaggerated response if too much ligand is present. The receptor theory assumes that all receptors should be occupied to produce a maximal response. In that case at half maximal effect EC50=kd. Sometimes, full effect is seen at a fractional receptor occupation")
21
Agonists and antagonists
10 Agonists and antagonists agonist has affinity plus intrinsic activity antagonist has affinity but no intrinsic activity partial agonist has affinity and less intrinsic activity competitive antagonists can be overcome

22
Agonist Drugs drugs that interact with and activate receptors; they possess both affinity and efficacy two types Full – an agonist with maximal efficacy Partial – an agonist with less then maximal efficacy

23
Agonist Dose Response Curves
Full agonist Partial agonist Response Dose

24
Antagonist Drug Antagonists interact with the receptor but do NOT change the receptor they have affinity but NO efficacy two types Competitive Noncompetitive

25
Competitive Antagonist
competes with agonist for receptor surmountable with increasing agonist concentration displaces agonist dose response curve to the right (dextral shift) reduces the apparent affinity of the agonist i.e., increases 1/Ke
 reduces the apparent affinity of the agonist i.e., increases 1/Ke")
26
Noncompetitive Antagonist
drug binds to receptor and stays bound irreversible – does not let go of receptor produces slight dextral shift in the agonist DR curve in the low concentration range this looks like competitive antagonist but, as more and more receptors are bound (and essentially destroyed), the agonist drug becomes incapable of eliciting a maximal effect
, the agonist drug becomes incapable of eliciting a maximal effect")
27
Desensitization 11 agonists tend to desensitize receptors
homologous (decreased receptor number) heterologous (decreased signal transduction) antagonists tend to up regulate receptors
 heterologous (decreased signal transduction) antagonists tend to up regulate receptors")
28
8 dose response curves-3 quantal dose response curves (used in populations, response is yes/no) Therapeutic index =Toxic Dose50/Effective Dose (TD50/ED50)
")
29
DR Curve: Whole Animal Graded – response measured on a continuous scale Quantal – response is an either/or event relates dose and frequency of response in a population of individuals often derived from frequency distribution of doses required to produce a specified effect

30
Effectiveness, toxicity, lethality
ED50 - Median Effective Dose 50; the dose at which 50 percent of the population or sample manifests a given effect; used with quantal dr curves TD50 - Median Toxic Dose 50 - dose at which 50 percent of the population manifests a given toxic effect LD50 - Median Toxic Dose 50 - dose which kills 50 percent of the subjects

31
Quantification of drug safety
TD50 or LD50 Therapeutic Index = ED50

32
Drug A 100 sleep death Percent Responding 50 ED50 LD50 dose

33
Drug B 100 sleep death Percent Responding 50 ED50 LD50 dose

34
The therapeutic index 9 The higher the TI the better the drug.
TI’s vary from: 1.0 (some cancer drugs) to: >1000 (penicillin) Drugs acting on the same receptor or enzyme system often have the same TI: (eg 50 mg of hydrochlorothiazide about the same as 2.5 mg of indapamide)
 to: >1000 (penicillin) Drugs acting on the same receptor or enzyme system often have the same TI: (eg 50 mg of hydrochlorothiazide about the same as 2.5 mg of indapamide)")
35
Signal transduction 4 enzyme linked ion channel linked
(multiple actions) ion channel linked (speedy) G protein linked (amplifier) nuclear (gene) linked (long lasting)
 ion channel linked. (speedy) G protein linked. (amplifier) nuclear (gene) linked. (long lasting)")
36
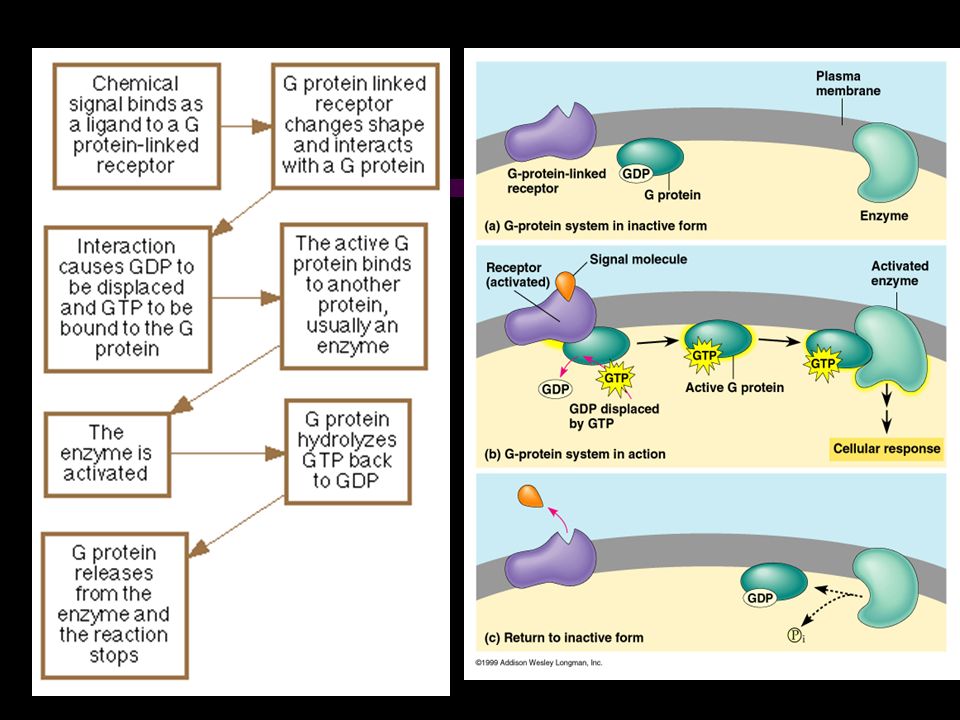
1. G protein-linked receptors
Structure: Single polypeptide chain threaded back and forth resulting in 7 transmembrane å helices There’s a G protein attached to the cytoplasmic side of the membrane (functions as a switch). 1. G protein-linked receptors
. 1. G protein-linked receptors")
38
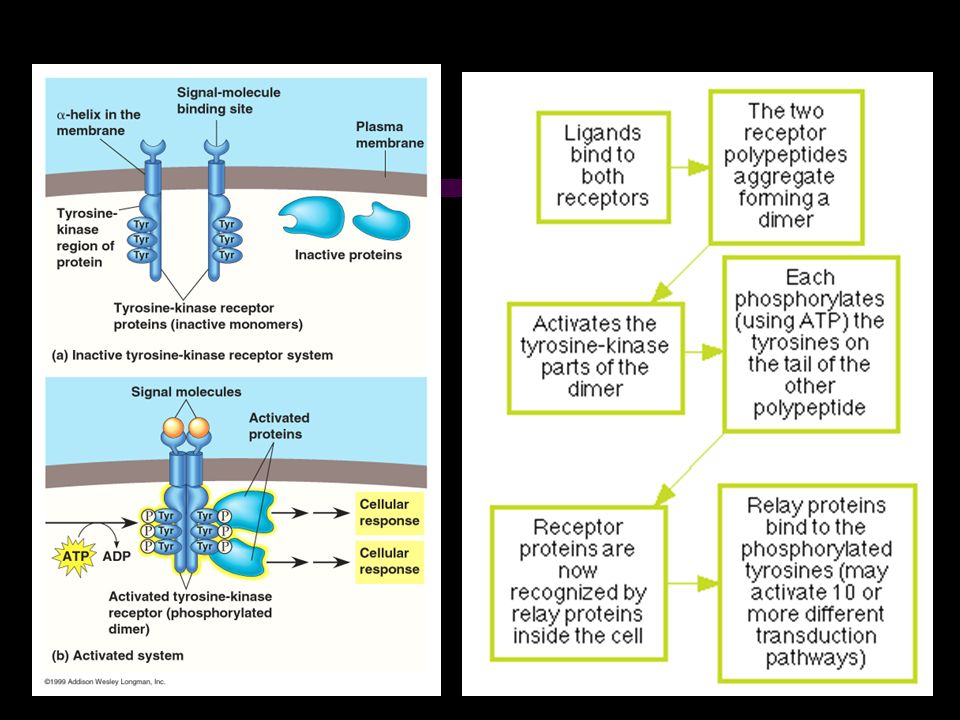
2. Tyrosine-kinase receptors
Structure: Receptors exist as individual polypeptides Each has an extracellular signal-binding site An intracellular tail with a number of tyrosines and a single å helix spanning the membrane

40
3. Ion channel receptors Structure:
Protein pores in the plasma membrane

41
Intracellular receptors
Not all signal receptors are located on the plasma membrane. Some are proteins located in the cytoplasm or nucleus of target cells. • The signal molecule must be able to pass through plasma membrane. Examples: ~Nitric oxide (NO) ~Steroid (e.g., estradiol, progesterone, testosterone) and thyroid hormones of animals).
 ~Steroid (e.g., estradiol, progesterone, testosterone) and thyroid hormones of animals)")
42
Small, nonprotein, water-soluble molecules or ions
B. Second Messengers Small, nonprotein, water-soluble molecules or ions Readily spread throughout the cell by diffusion Two most widely used second messengers are: 1. Cycle AMP 2. Calcium ions Ca2+

43
2. Calcium Ions (Ca2+) and Inositol Trisphosphate
Calcium more widely used than cAMP used in neurotransmitters, growth factors, some hormones Increases in Ca2+ causes many possible responses: Muscle cell contraction Secretion of certain substance Cell division

44
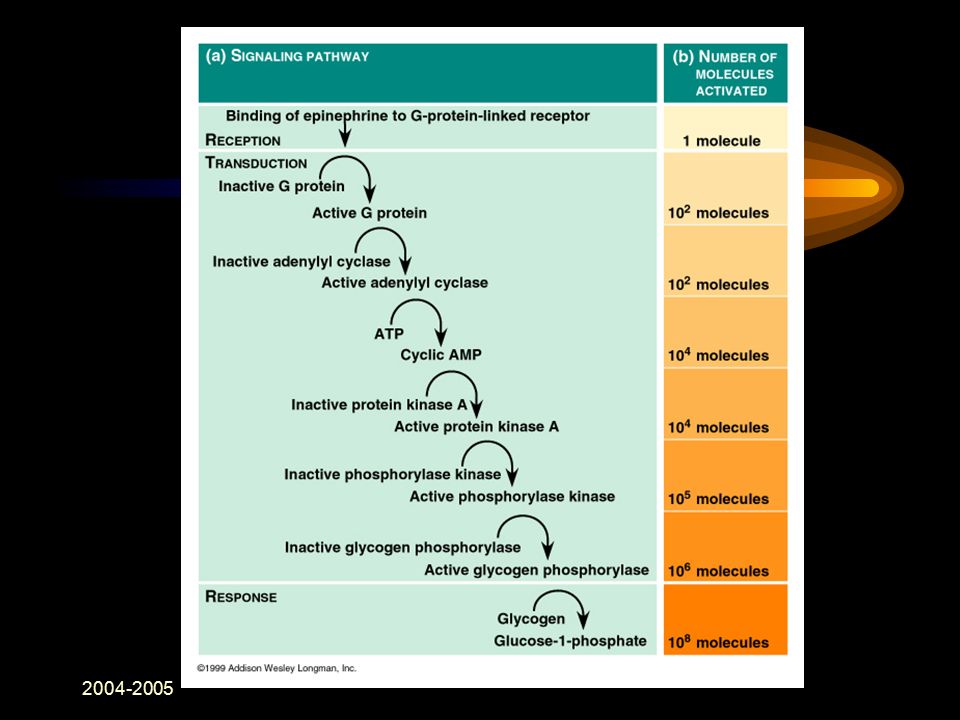
Two benefits of a signal-transduction pathway 1. Signal amplification
2. Signal specificity A. Signal amplification Proteins persist in active form long enough to process numerous molecules of substrate Each catalytic step activates more products then in the proceeding steps

46
Summary 12 most drugs act through receptors
there are 4 common signal transduction methods the interaction between drug and receptor can be described mathematically and graphically agonists have both affinity (kd) and intrinsic activity () antagonists have affinity only antagonists can be competitive (change kd) or non-competitive (change ) when mixed with agonists agonists desensitize receptors. antagonists sensitize receptors.
 and intrinsic activity () antagonists have affinity only. antagonists can be competitive (change kd) or. non-competitive (change ) when mixed with agonists. agonists desensitize receptors. antagonists sensitize receptors")
Similar presentations