Download presentation
Presentation is loading. Please wait.

1
Hawthorne Elementary Board Report 2008 – 2009 Kennewick School District

2
Percent of Students by Ethnicity

3
Percent of Low Income Students

4
Kindergarten Test Results Fall and Spring at Hawthorne Average Percent Correct

5
First Grade DRA Test History

6
Second Grade DRA Test History

7
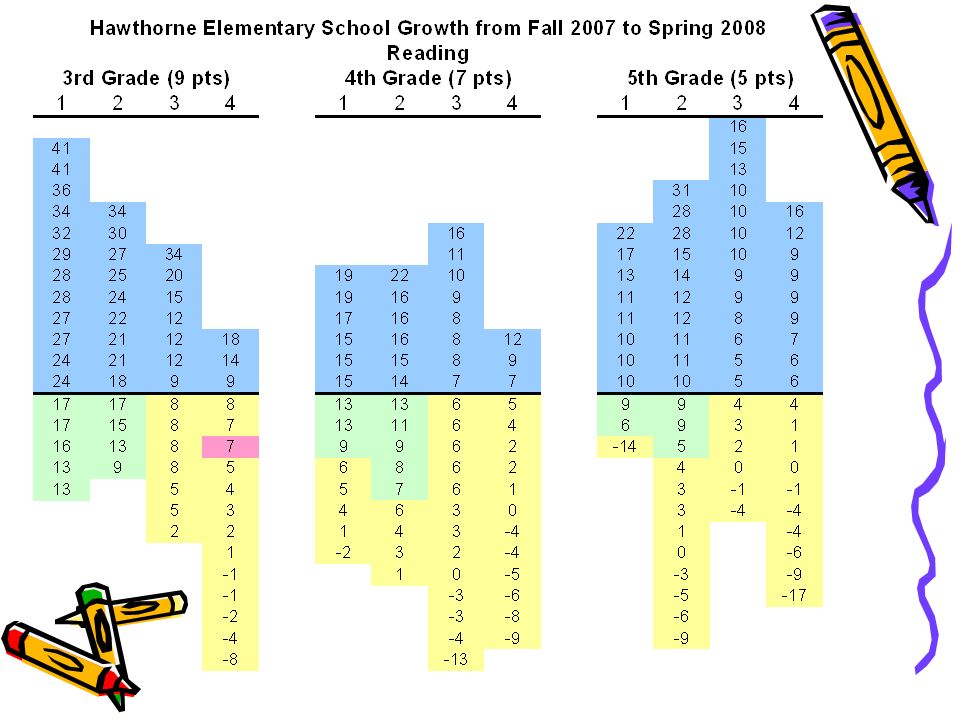
DRA Growth From Spring 2007 - 1st Graders to Spring 2008 - 2nd Graders

8
Percent of Third Graders Reaching a Fall RIT of 188 and a Spring RIT of 194 on Reading Level Tests Percents are based on total enrollment.

9
Percent of Fourth Graders Reaching a Spring RIT of 199 on Reading Level Tests *Before Spring 2001 – 4th Grade Goal - 201 Percents are based on total enrollment.

10
Percent of Fourth Graders Meeting the Standard WASL Reading

11
Fourth Grade Reading WASL Results by Level

12
Percent of Fourth Graders Meeting the Standard WASL Writing

13
Percent of Fourth Graders Meeting the Standard WASL Math

14
Fourth Grade Math WASL Results by Level

15
Percent of Fifth Graders Reaching a Spring RIT of 207 on Reading Level Tests Percents are based on total enrollment.

16
Fifth Graders Above the 50 th Percentile on Spring Reading Level Tests Percents are based on number of students tested

17
Fifth Graders Above the 50 th Percentile on Spring Math Level Tests Percents are based on number of students tested

18
Reading Level Test History Percent of Students Reaching the Spring District Reading Goal Goal: 3rd Grade RIT of 194 4th Grade RIT of 199 5th Grade RIT of 207 The Control Group is a set of students tracked from 3rd to 5th Grade

19
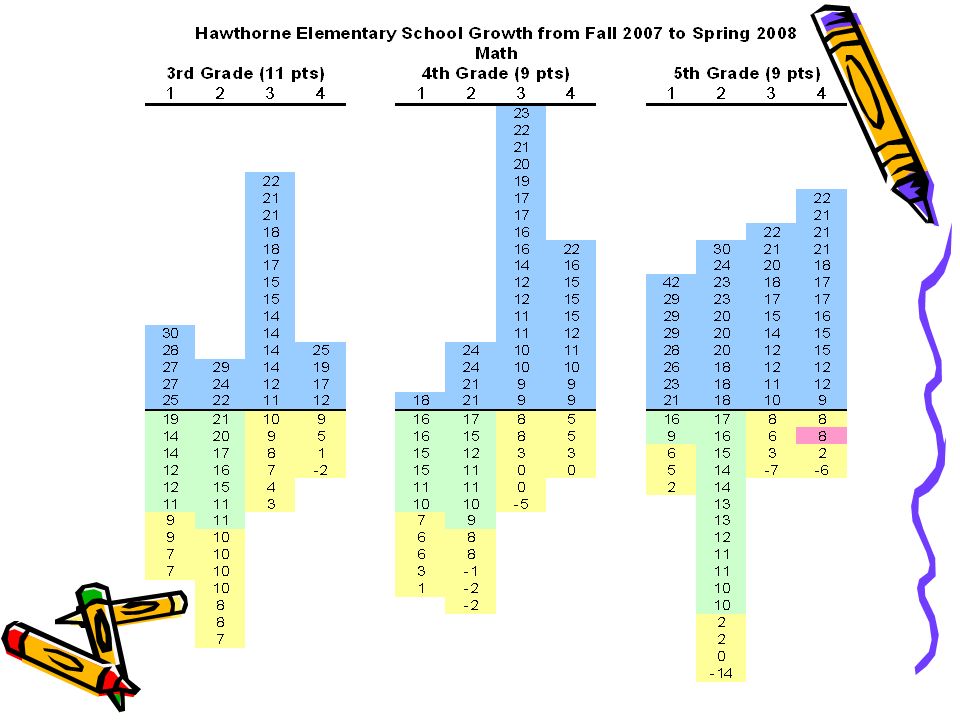
Math Level Test History Percent of Students Reaching the Spring District Math Goal Goal: 3rd Grade RIT of 195 4th Grade RIT of 202 5th Grade RIT of 210 The Control Group is a set of students tracked from 3rd to 5th Grade

22
WASL Trend - Ethnic

23
WASL 2008 Percent Meeting Standard

24
2008 – 2009 School Improvement Focus Implementation of Response to Intervention Implementation of “Imagine It!” Reading Curriculum Implementation of All Day Kindergarten

Similar presentations


: Early March Multiple Choice.>")

 Dr. Michael Power Assist. Superintendent.>")


