Download presentation
Presentation is loading. Please wait.

1
Spectrally High resolution Infrared measurements for the characterisation of Volcanic Ash (SHIVA): a new way to study volcanic processes Elisa Carboni
: a new way to study volcanic processes Elisa Carboni")
2
Identify ash composition from information contained in infrared spectra to study their change during an eruption, to better understand the volcanic process that control eruptive activity. How we do it: Developing algorithms using new ash optical properties to retrieve ash characteristics from data collected with three different hyperspectral observing systems: ground-based absorption spectra FTIR and satellite-based emission spectra (from the limb MIPAS and from nadir IASI). Validating the results, with geochemical and petrological analysis of ash samples and with reference to laboratory refractive index measurements of ash samples. Objective
. Validating the results, with geochemical and petrological analysis of ash samples and with reference to laboratory refractive index measurements of ash samples. Objective.")
3
Component and morphological analyses of the erupted ash, and comparison of these data with those from other monitoring techniques, demonstrates a clear relationship between ash features and styles of explosive activity. Scientific Background. Basaltic Andesitic Rhyolitic Increasing SiO 2 % Extinction coefficients obtained for ice, volcanic ash (Peters, 2012), pumice, andesite, H 2 SO 4, quartz, obsidian. Increasing explosivity of volcanic activity
, pumice, andesite, H 2 SO 4, quartz, obsidian. Increasing explosivity of volcanic activity.")
4
Scientific Background IASI observations of three dust storms and seven volcanic ash plumes (Kasatochi 8/2008, Eyjafjallajoküll 4/2010, Sarychev 6/2009, Montserrat 2/2010, Kliuchevskoi 6/2010 and Chaitén 4/2008) from Clarisse et al. (2010).
..")
5
Method FTIR IASI MIPAS Optimal estimation approach (Rodgers, 2000) to retrieve ash composition and possibly size from infrared spectral measurements. We will study ash formed from different magmas and at different stages of evolution within a volcanic plume. + Ash sample analysis ground and satellite retrievals ash type/composition (with different size distributions) to be compared with the analysis done on ash sample for the same volcanic plume. one-to-one correspondence between refractive index spectra, compositions and remote sensing measurements.
 to be compared with the analysis done on ash sample for the same volcanic plume. one-to-one correspondence between refractive index spectra, compositions and remote sensing measurements..")
6
Ash optical properties – WP1 literature survey + Dan meas. + TEM, SEM meas. ash refractive index, morphology and size spectral extinction coefficient, spectral single scattering albedo and phase function simulations of spectrometer measurements Mie (spherical particles) or T-matrix (non-spherical) - Log-normal size distributions, 2 or more components - External or internal mixing - Coating of the ash particles with water, ice or sulphuric acid Spectral extinction coefficient for different effective radius, obtained using the same volcanic ash refractive index (Peters, 2013). We can consider: Opt. prop. Deliverable: Database of spectral ash and volcanic aerosol optical properties available through the project web page. one to one
 or T-matrix (non-spherical) - Log-normal size distributions, 2 or more components - External or internal mixing - Coating of the ash particles with water, ice or sulphuric acid Spectral extinction coefficient for different effective radius, obtained using the same volcanic ash refractive index (Peters, 2013). We can consider: Opt. prop. Deliverable: Database of spectral ash and volcanic aerosol optical properties available through the project web page. one to one.")
7
Ground transmittance analysis (FTIR) – WP2 Fourier transform infrared spectroscopy (FTIR) transmittance measurements from 800 to 5000 cm -1. Retrieved parameters: ash optical depth AOD and effective radius Reff and possibly other (mode radius, spread and components) depending on the information content InstituteVolcano INGV Etna (2002/2003), Iceland (April 2010) Earth Science, CambridgeSoufriere Hills, Kilauea, Geography, CambridgeErebus, Yasur, Nyiragongo, Erta' Ale, Masaya, Poas, Villarrica, Soufriere Hills Project partners and measurements available. Deliverable: (1) Forward model to reproduce the FTIR measurements and retrieval code for analysis. (2) A publication describing the ash/aerosol retrieval using FTIR measurements and including the results of the analysis. Forward Model Options: - Thin plume -> a single scattering model - Thicker plume -> DISORT (include multiple scattering and thermal emission) - others? Problems: transmittance? Radiometric drift? Different sources?
 depending on the information content InstituteVolcano INGV Etna (2002/2003), Iceland (April 2010) Earth Science, CambridgeSoufriere Hills, Kilauea, Geography, CambridgeErebus, Yasur, Nyiragongo, Erta Ale, Masaya, Poas, Villarrica, Soufriere Hills Project partners and measurements available. Deliverable: (1) Forward model to reproduce the FTIR measurements and retrieval code for analysis. (2) A publication describing the ash/aerosol retrieval using FTIR measurements and including the results of the analysis. Forward Model Options: - Thin plume -> a single scattering model - Thicker plume -> DISORT (include multiple scattering and thermal emission) - others. Problems: transmittance. Radiometric drift. Different sources .")
8
IASI – WP3 The RTTOV output for a clean atmosphere (containing gas but not cloud or aerosol/ash) will be combined with an the ash/cloud layer using the ORAC scheme Retrieved parameters: ash optical depth (at a reference wavelength tbd), ash effective radius, ash type and layer altitude. We will assess the ability of the retrieval to distinguish the type of layer over a range of ash-aerosol-cloud mixtures Comparison with: (1) independent IASI retrieval (project partner: University of Bristol), (2) ASTER ash retrieval (project partner: University of Bristol) (3) ORAC ash and cloud retrievals from the SEVIRI and AATSR. (4) independent ash retrieval from SEVIRI and MODIS (project partner INGV) (5) CALIPSO measurements. Deliverables: (1) retrieval code for IASI ash; (2) a publication. We have a forward model that simulate IASI spectra with ash and SO2 and can include two separate layers (e.g. ash above cloud).
 independent IASI retrieval (project partner: University of Bristol), (2) ASTER ash retrieval (project partner: University of Bristol) (3) ORAC ash and cloud retrievals from the SEVIRI and AATSR. (4) independent ash retrieval from SEVIRI and MODIS (project partner INGV) (5) CALIPSO measurements. Deliverables: (1) retrieval code for IASI ash; (2) a publication. We have a forward model that simulate IASI spectra with ash and SO2 and can include two separate layers (e.g. ash above cloud)..")
9
IASI FAST FORWARD MODEL b a c d I ac R c, e c, T c,B c R s, e s, B s T ac I bc,T bc atm. above aerosol layer atm. belowe surface We need to divide the contributions between atmosphere and aerosol layer components LUTs for aerosol layer parameters The suffix ‘c’ refers to aerosol layer Other atmospheric parameters (radiances above/below aerosol layer going up/down) are computed with RTTOV using ECMWF atmospheric profiles.
 are computed with RTTOV using ECMWF atmospheric profiles..")
10
Ash Re=2 [ m], h=3 [km] Dust Re=2 [ m], h=3 [km] Water Cloud Re=10 [ m], h=3 [km] IASI forward model include aerosol and cloud. Obtained with ‘Aso’ refractive index measured by Daniel Peters. Ash and cloud IASI forward model
![Ash Re=2 [ m], h=3 [km] Dust Re=2 [ m], h=3 [km] Water Cloud Re=10 [ m], h=3 [km] IASI forward model include aerosol and cloud.](http://images.slideplayer.com/24/7274929/slides/slide_10.jpg "Obtained with ‘Aso’ refractive index measured by Daniel Peters. Ash and cloud IASI forward model.")
11
MIPAS – WP4 The spatial distribution of measurements from MIPAS is more sparse than IASI, but provides accurate information on the ash or cloud top layer altitude (Hurley et al. 2011, Spang et al. ACP 2012). Two approaches for ash retrieval will be tested: (1) Fitting the measurements using an ash MIPAS forward model (to be developed) and the optical properties from WP1. (2) Using a singular vector decomposition (SVD) technique, as successfully applied for cloud retrieval (Hurley et al., 2011). Deliverables: (1) retrieval code for MIPAS ash; (2) A publication describing the ash/aerosol retrieval using MIPAS measurements and including the results of the analysis.
. Two approaches for ash retrieval will be tested: (1) Fitting the measurements using an ash MIPAS forward model (to be developed) and the optical properties from WP1. (2) Using a singular vector decomposition (SVD) technique, as successfully applied for cloud retrieval (Hurley et al., 2011). Deliverables: (1) retrieval code for MIPAS ash; (2) A publication describing the ash/aerosol retrieval using MIPAS measurements and including the results of the analysis..")
12
Validation/comparison and interpretation – WP5 - Test consistency of retrieved composition from different sensors (IASI, MIPAS, FTIR) - Compare remotely sensed composition (ash type) with samples taken on ground. - Case studies to observe how ash/aerosol size distribution and composition changes as a function of time (or others parameters) to obtain information on the volcanic processes. - Improve prediction of ash characteristcs by studying relationships between ash concentration and size with other parameters: - measures of volcanic activity (plume height/seismicity etc) - the involvement of external water sources., - the gas (e.g. SO2) flux etc.
 to obtain information on the volcanic processes. - Improve prediction of ash characteristcs by studying relationships between ash concentration and size with other parameters: - measures of volcanic activity (plume height/seismicity etc) - the involvement of external water sources., - the gas (e.g. SO2) flux etc..")
13
Wish list: output of the day ? How we can define a finite number of ash/aerosol model (3-10?) that correspond to ash composition/optical properties to be used in the retrievals? (possibly distinguishable ash model) How to link satellite and ground base measurements? Can we relate FTIR measurements with satellite? With ash sample measurements? What is more interesting to retrieve/study? What can tell us something about volcanic processes? (aerosol type/ash composition, amount, dimension, variation in time?) Define tasks, deadline and who will work on them. (tasks should become papers!?!) Define how we will be in contact after the workshop: mail list? Teleconference? Others?
 that correspond to ash composition/optical properties to be used in the retrievals. (possibly distinguishable ash model) How to link satellite and ground base measurements. Can we relate FTIR measurements with satellite. With ash sample measurements. What is more interesting to retrieve/study. What can tell us something about volcanic processes. (aerosol type/ash composition, amount, dimension, variation in time ) Define tasks, deadline and who will work on them. (tasks should become papers! !) Define how we will be in contact after the workshop: mail list. Teleconference. Others .")
15
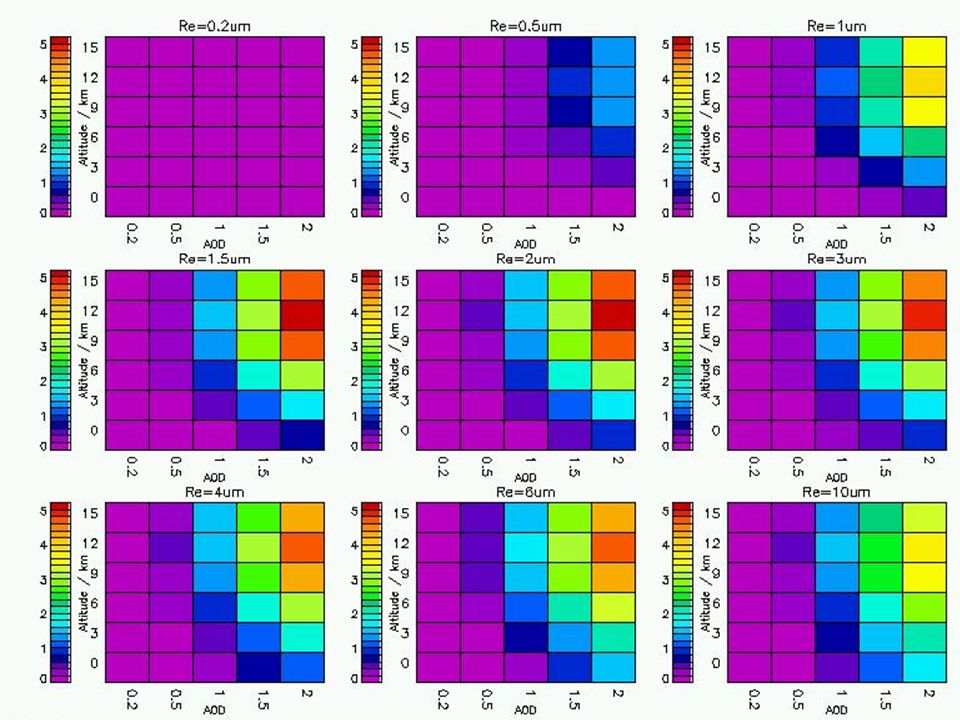
2 between simulated IASI spectra with dust and ash, as function of different dust AOD and altitude 2 = (y dust -m ash ) T S ash -1 (y dust -m ash ). (1)ash cloud can be discriminated from other dust or aerosol clouds? : Aod=[0.2,0.5,1,1.5,2]; Reff=[0,2,0.5,1, 1.5,2,3,4,6,10] micron; H=[0,2,6,9,12,15] km. All simulations of IASI ash spectra have been used to compute the covariance matrix S ash and the mean spectra m ash of ash. Values higher then 1700 (dark blu) have probability less the 0.04 to be obtained (with the number of channel considered e.g. 1601), it means that the dust spectra is not fitted by the ash model, so ash and dust (with the assumed refractive index and optical properties) are distinguishable.
ash cloud can be discriminated from other dust or aerosol clouds. : Aod=[0.2,0.5,1,1.5,2]; Reff=[0,2,0.5,1, 1.5,2,3,4,6,10] micron; H=[0,2,6,9,12,15] km. All simulations of IASI ash spectra have been used to compute the covariance matrix S ash and the mean spectra m ash of ash. Values higher then 1700 (dark blu) have probability less the 0.04 to be obtained (with the number of channel considered e.g. 1601), it means that the dust spectra is not fitted by the ash model, so ash and dust (with the assumed refractive index and optical properties) are distinguishable..")
17
For the same state vector the ash and dust case have different spectral shape of the jacobian. (IASI FM)
.")
19
Initial state estimate: x 0 A priori: x a Run forward model: f(x i ) Compare to J = [y - f(x i )]S e -1 [y - f(x i )] + measurements (y): [x i - x a ]S a -1 [x i - x a ] Update state: x i → x i+1 (Levenburg-Marquardt) Stop when: J is small, or when i is large. OPTIMAL ESTIMATION[Rodgers 2000] NB Optimal estimation method provides quality control and error estimate RETRIEVAL METHOD
![Initial state estimate: x 0 A priori: x a Run forward model: f(x i ) Compare to J = [y - f(x i )]S e -1 [y - f(x i )] + measurements (y): [x i - x a ]S a -1 [x i - x a ] Update state: x i → x i+1 (Levenburg-Marquardt) Stop when: J is small, or when i is large.](http://images.slideplayer.com/24/7274929/slides/slide_19.jpg "OPTIMAL ESTIMATION[Rodgers 2000] NB Optimal estimation method provides quality control and error estimate RETRIEVAL METHOD.")
20
The optimal estimate of x taking into account total measurement error may be computed as: Sytot is computed considering an appropriate ensemble of N measured spectra to construct an estimate of total measurement error variance-covariance Syobs [Rodger 2000] OE detection theory [ Walker, Dudhia, Carboni, Atmos. Meas. Tech. Discuss., 2010 ]
![The optimal estimate of x taking into account total measurement error may be computed as: Sytot is computed considering an appropriate ensemble of N measured spectra to construct an estimate of total measurement error variance-covariance Syobs [Rodger 2000] OE detection theory [ Walker, Dudhia, Carboni, Atmos.](http://images.slideplayer.com/24/7274929/slides/slide_20.jpg "Meas. Tech. Discuss., 2010 ].")
21
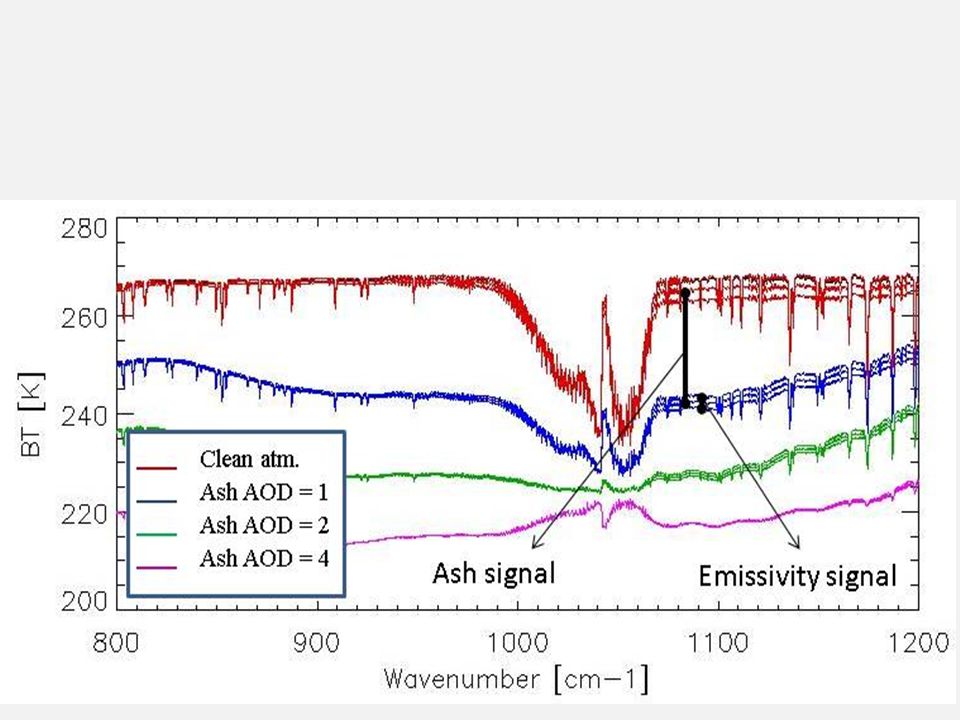
Thermal infrared spectra Wavenumber [cm-1] Brightness Temperature [k] SO2 absorption bands 1 3 ash
![Thermal infrared spectra Wavenumber [cm-1] Brightness Temperature [k] SO2 absorption bands 1 3 ash](http://images.slideplayer.com/24/7274929/slides/slide_21.jpg "Thermal infrared spectra Wavenumber [cm-1] Brightness Temperature [k] SO2 absorption bands 1 3 ash")
22
AEROSOL OPTICAL PROPERTIES Microphysical propertiesEvery component is characterized by: Spectral refractive index m( ) + i k( ) Mode radius r m and spread Changing the mixing ratio between component we obtain the optical properties corresponding to different effective radius K ext ( ) ( ) < 1 P( , ) Aerosol class with more components Volcanic ash: 1 component only Changing the mode radius r m (= tranlation of the log normal)
 + i k( ) Mode radius r m and spread Changing the mixing ratio between component we obtain the optical properties corresponding to different effective radius K ext ( ) ( ) < 1 P( , ) Aerosol class with more components Volcanic ash: 1 component only Changing the mode radius r m (= tranlation of the log normal)")
Similar presentations


 Aerosol retrievals using MSG-SEVIRI images Y.S. Bennouna and G. de Leeuw.>")


 Monitoring the Hawaii Volcano Plume From Satellite By John Porter School of Ocean Earth Science and Technology, University of Hawaii, Honolulu,>")

