Download presentation
Presentation is loading. Please wait.

1
NRRA Recycling Jobs – Now and in the Future CRI’s Jobs Study: Returning to Work Susan V. Collins Container Recycling Institute June 5, 2012 Container Recycling Institute: Striving to make North America a global model for the collection and quality recycling of packaging materials.

2
Mission Statement CRI’s mission is to make North America a global model for the collection and quality recycling of packaging materials. We do this by: ► Creating and maintaining a database on containers and packaging ► Studying container and packaging reuse and recycling options and legislation, including deposit systems, and their environmental and economic impacts ► Educating on recycling options for government, elected officials, for citizen groups, the print and broadcast media, publications and industry groups ► Creating national networks

3
Prepared by: Sound Resource Management

4
Project Background ► Development of performance indicators: weight; volume; energy savings; pollution prevention; cost; and impact on domestic jobs ► Limited specificity in data on jobs from recycling; ► Need to further explore how & why these jobs are created, and provide a jobs estimate.

5
Project Goals ► Measure direct impacts on domestic jobs ► From increased recycling of beverage containers Glass, aluminum & PET ► Compare different types of recycling programs to landfill disposal ► Create a calculator: “Measuring the Impact from Recycling on Jobs” calculator (MIRJcalc) (user inputs available)
 (user inputs available)")
7
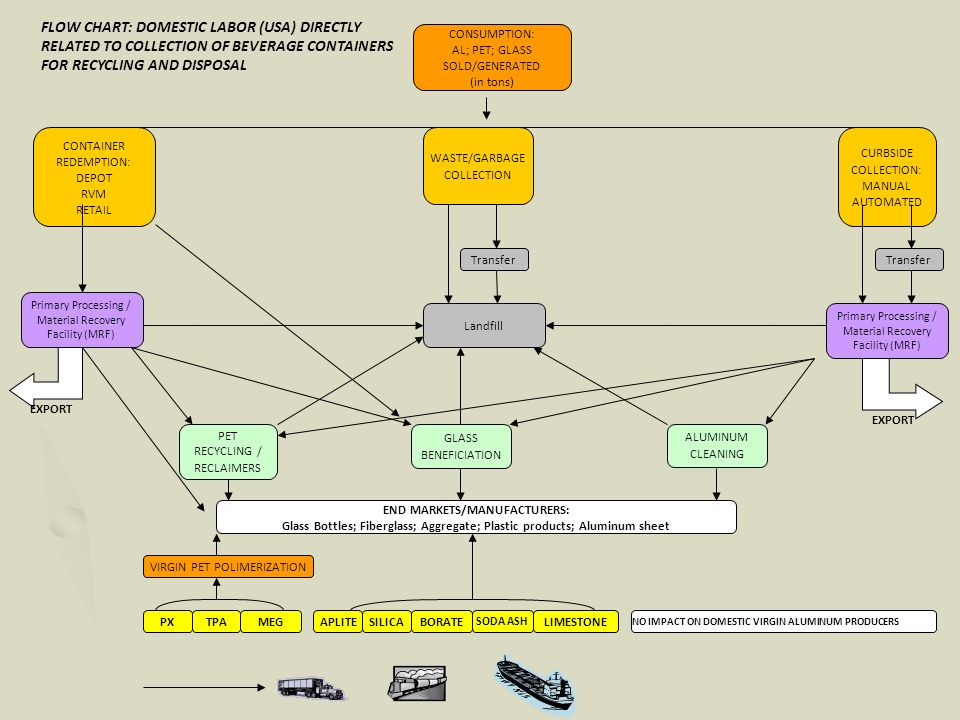
Study Methodology ► Primary data collection – data points each for “stage”: 1. Collection (includes transport to MRF or transfer station) 2. Operations at MRF, transfer station or landfill 3. Transport to landfill 4. Secondary processing 5. End-use manufacturing (virgin or recycled content) 6. Raw materials extraction and refining 7. Administration/supervision/auxiliary positions
 2. Operations at MRF, transfer station or landfill 3. Transport to landfill 4. Secondary processing 5. End-use manufacturing (virgin or recycled content) 6. Raw materials extraction and refining 7. Administration/supervision/auxiliary positions.")
8
Study Methodology ► “NET Jobs impact from increased recycling” is calculated as: ► Number of jobs created when more beverage containers are recycled ► Minus the number of jobs lost when fewer containers are landfilled ► Minus the number of jobs lost in raw-materials extraction and processing when recycled content replaces virgin materials in product manufacturing

9
Model Exclusions Recycling-reliant employment Indirect effect Induced effect Out-of-country

10
Quantifying Jobs Impact Data ► Identify a reasonable estimate for the number of employees (FTEs) per 1000 ton throughput of PET, Aluminum and Glass at each stage (collection, processing and secondary processing) ► Identify a reasonable estimate for the FTEs for extraction and preparation of virgin material.
 per 1000 ton throughput of PET, Aluminum and Glass at each stage (collection, processing and secondary processing) ► Identify a reasonable estimate for the FTEs for extraction and preparation of virgin material.")
11
Recipes ► PET: Paraxylene + ethylene oxide converted to MEG ► Silica, soda ash, aplite, Limestone, Borates

12
Overview of Findings

13
Finding #3 ► Material throughput is the primary driver of recycling jobs. ► Policies that require more recycling can create more jobs Residential, commercial, etc.

14
Findings on Curbside Collection ► Urban, rural, geographically diverse ► No significant difference for jobs from single- versus dual-stream ► Critical factor was automated versus manual Automated is.79 FTEs per 1,000 tons Manual is 2.11 FTEs per 1,000 tons ► Also included administration, customer service, mechanics, etc.

15
Finding #5 ► Jobs gained in recycling far outweigh any jobs lost in extraction of virgin materials. Increased jobs reflects a trade-off between labor and machinery Does not necessarily mean an increase in cost

16
Finding #8 ► Jobs gained in recycling far exceed any jobs lost in extraction of virgin materials, landfilling or domestic manufacturing. Full report shows: ► Increases from recycling ► Decreases from landfilling, virgin material extraction and domestic manufacturing ► Total net increase

17
Comparing the Jobs from Recovering Glass vs. Virgin Raw Material Extraction 8.3 0.1 0.04 0.6 0 1 2 3 4 5 6 7 8 9 Recycled raw material - 1000 tons of glass Virgin raw materials for 1000 tons of glass bottles Virgin raw material for 1000 tons of fibreglass Virgin raw materials for 1000 tons of aggregate FTEs per 1000 tons

18
Finding on PET Virgin Production ► Domestic, 83% ► Imported, 17%

19
Comparing the Jobs from Recovering PET vs. Virgin Raw Material Production 9.9 0.6 0 2 4 6 8 10 12 Recycled raw material - 1000 tons of PET Virgin raw materials for 1000 tons of PET resin FTEs per 1000 tons

21
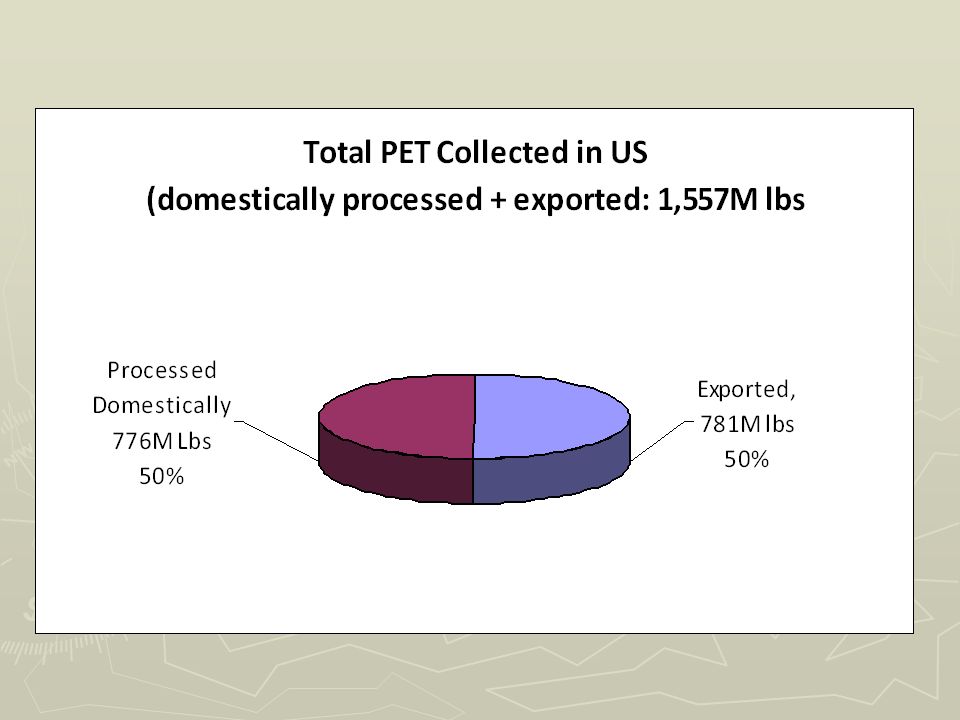
Finding #6 ► U.S. PET reclaimers operate at less than 72% of capacity (vs. 60% in report) ► Increasing to capacity would: Process an additional 230,000 tons annually in the U.S. Create nearly 500 jobs in the U.S. ► New capacity has come on line in 2012
 ► Increasing to capacity would: Process an additional 230,000 tons annually in the U.S. Create nearly 500 jobs in the U.S. ► New capacity has come on line in")
23
Finding #7 ► The U.S. exports 400,000 tons of PET to overseas markets each year ► If this material were processed in the U.S. It would create 800 jobs in the U.S. ► Most of the exported PET is lower-quality bales

24
Conclusions ► As recovery tonnage increases, employment related to collection, processing and secondary processing also increases (excepting exports) ► Losses that occur in primary resource- extraction activities are greatly outnumbered by the jobs created in material-recovery activities.
 ► Losses that occur in primary resource- extraction activities are greatly outnumbered by the jobs created in material-recovery activities.")
25
Conclusions ► Improved material quality directly impacts U.S. jobs; clean/separated recyclables more likely to stay in the U.S. for use by domestic manufacturers rather than be exported to foreign markets

26
Beyond Jobs ► U.S consumer products manufacturers use recycled materials to meet other goals Reduce energy use Reduce emissions and other environmental impacts Reduce production and raw materials costs

27
Beyond Jobs, continued ► U.S consumer products manufacturers use recycled materials to meet other goals Meet internal or industry goals for recycled content and sustainability Satisfy public demand for “greener” products, packaging and business practices

28
Economic Value of Buried Materials 28 Material Type (beverage only) Price per tonValue of Existing Scrap Recycling (Recovered) Value of Scrap Currently Wasted Aluminum$1,300$910 million$1 billion PET$640$325 million$1.3 billion Glass$25$68 million$175 million TotalN/A$1.303 billion$2.475 billion
 Price per tonValue of Existing Scrap Recycling (Recovered) Value of Scrap Currently Wasted Aluminum$1,300$910 million$1 billion PET$640$325 million$1.3 billion Glass$25$68 million$175 million TotalN/A$1.303 billion$2.475 billion")
29
Beyond Jobs, Glass ► For every 10% increase in cullet use, there is a corresponding 4% savings in energy ► For every ton of cullet used, they save 1.1 tons of silica (sand), lime, dolomite and soda ► For every 10% increase in cullet use: Six degree celsius reduction in furnace temp, which reduces particulates by 7%, and extends furnace life 3% reduction in fossil fuel use; 6% reduction in oxides of nitrogen (Nox)
, lime, dolomite and soda ► For every 10% increase in cullet use: Six degree celsius reduction in furnace temp, which reduces particulates by 7%, and extends furnace life 3% reduction in fossil fuel use; 6% reduction in oxides of nitrogen (Nox)")
30
How can this research help me? ► Use Impact Data to help estimate jobs impact for a recovery program ► Support waste recovery systems that ensure high rates of capture and keep material clean/separated. This material will create more local and domestic jobs than would a dirtier mix of recyclables ton for ton.

31
Data Transparency ► We included all data in appendices ► We invite you to use it to your benefit

32
Jobs Calculator ► Input two-letter code for State to automatically calculate the number of jobs that will be created ► User can customize and change certain inputs ► Percent of households with curbside recycling ► Capture rates for multi-family, non-curbside single-family, self-haul, and away-from-home ► Curbside automated versus manual mix ► Allocation of materials to various end-markets

33
Jobs Calculator ► Input two-letter code for State to automatically calculate the number of jobs that will be created ► User can customize and change certain inputs ► http://www.container-recycling.org/ http://www.container-recycling.org/ ► http://www.container-recycling.org/issues/jobs.htm http://www.container-recycling.org/issues/jobs.htm ► Jobs page has CRI Study, “Returning to Work,” the jobs calculator, and links to several other studies on recycling jobs

34
Just type in: Container Recycling Institute! Visit us at… www. container-recycling.org Weekly Headlines newsletter (310) 559-7451
")
Similar presentations


 on Technological Innovation and Policy. The Case of Poly(ethylene therephthalate) (PET) Snezana.>")


 implementation Dr Michael Warhurst, Resource and Consumption campaign Friends of the Earth Europe June.>")


