Download presentation
Presentation is loading. Please wait.

1
WATER ASSESSMENT AND TESTING Introduction to Watershed Science Merritt College Marc Epstein, Instructor

2
WATER MONITORING BASICS Collection of Data Episodic (such as a spill) Synoptic (like snapshot day) Periodic and on a regular basis Continuous over long period of time Consistent collection methods
 Synoptic (like snapshot day) Periodic and on a regular basis Continuous over long period of time Consistent collection methods")
3
ANALYSIS DEFINED An investigation into whether a waterbody can support the beneficial uses assigned to it.

4
Water quality monitoring is commonly defined as the sampling and analysis of water (lake, stream, river, estuary, or ocean) and conditions of the waterbody.
 and conditions of the waterbody.")
5
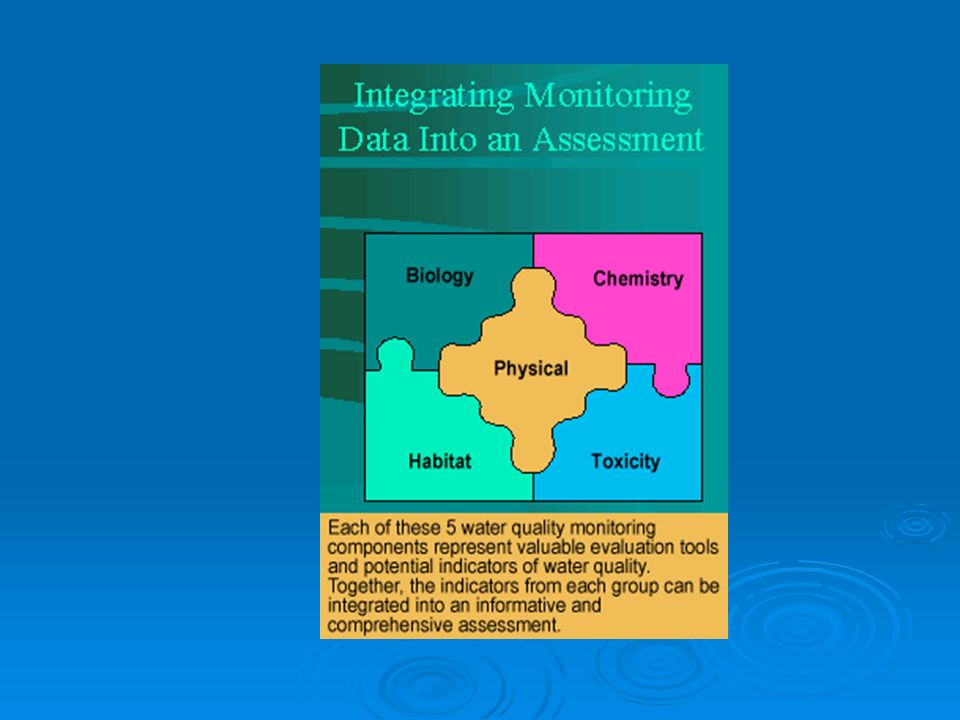
TYPES OF MONITOING Biological Chemical Physical

6
BIOLOGICAL Include measures related to the plant and animal life of the water body, such as: Fish species diversity and abundance; Presence or absence of indicator fishes, aquatic invertebrates, or aquatic plants.

7
CHEMICAL Include contaminants such as: Metals Dissolved nutrients Oils Pesticides Chemical properties of the aquatic system such as: Dissolved oxygen Chemical oxygen demand Acid neutralizing capacity

8
PHYSICAL Include general conditions such as: Temperature Flow Sediment characteristics Water color Within-channel habitat structure

10
WHAT IS KWEST MONITORING Total Maximum Daily Load (TMDL) A calculation of the maximum amount of a pollutant that a waterbody can receive and still meet water quality standards, and an allocation of that amount to the pollutant's sources. Water quality standards are set by States, Territories, and Tribes. They identify the uses for each waterbody, for example, drinking water supply, contact recreation (swimming), and aquatic life support (fishing), and the scientific criteria to support that use. A TMDL is the sum of the allowable loads of a single pollutant from all contributing point and nonpoint sources. The calculation must include a margin of safety to ensure that the waterbody can be used for the purposes the State has designated. The calculation must also account for seasonal variation in water quality. (From federal Clean Water Act)
, and aquatic life support (fishing), and the scientific criteria to support that use. A TMDL is the sum of the allowable loads of a single pollutant from all contributing point and nonpoint sources. The calculation must include a margin of safety to ensure that the waterbody can be used for the purposes the State has designated. The calculation must also account for seasonal variation in water quality. (From federal Clean Water Act).")
11
THE BASIC FIVE WATER QUALITY VITAL SIGNS Temperature Dissolved Oxygen pH Conductivity and Salinity Turbidity

12
TEMPERATURE Measure of average kinetic energy of water molecules Affects water chemistry and aquatic organisms Influences: Amount of oxygen that can be dissolved Rate of photosynthesis Metabolic rate of organisms Sensitivity of organisms to toxic waste, parasites, and diseases Timing of reproduction and migration of organisms

13
Code (Note a) DeviceCostLaborApplicationLimitationsMajor sources of error TRBulb thermometers $5-201 minuteAir, Surface water, or sample in jar Low resolution (0.5 C to 1 C) Inaccurate setting by manufacturer, disconnection of capillary tube from scale, air bubbles in tube TRMU-shaped Min- Max thermometer $251 minuteAir, incubation chambers Low resolution (1 C). Not recommende d for field use (mercury) Inaccurate setting by manufacturer, disconnection of capillary tube from scale, air bubbles in tube, incomplete resetting TTDigital Thermometer $252 minAir, Surface water, inside soil or sediment Needs batteries Inaccurate setting by manufacturer, drift from original setting TTThermistor probesvarVertical gradientsResponse depends on length of cable Inaccurate setting by manufacturer, drift from original setting THHobo- Temperature Data loggers $60- 100 10 min (program) 10 min download, plus deployment labor Continuous measurements of temperature in the environment Requires use of computer, need to buy software Inaccurate setting by manufacturer, drift from original setting TTPSonde/datalogger probe ~$4,00 0 for entire Sonde 1 minDiscrete or continuous measurements Requires use of computer, need to buy software Inaccurate setting by manufacturer, drift from original setting
 Inaccurate setting by manufacturer, disconnection of capillary tube from scale, air bubbles in tube, incomplete resetting TTDigital Thermometer $252 minAir, Surface water, inside soil or sediment Needs batteries Inaccurate setting by manufacturer, drift from original setting TTThermistor probesvarVertical gradientsResponse depends on length of cable Inaccurate setting by manufacturer, drift from original setting THHobo- Temperature Data loggers $ min (program) 10 min download, plus deployment labor Continuous measurements of temperature in the environment Requires use of computer, need to buy software Inaccurate setting by manufacturer, drift from original setting TTPSonde/datalogger probe ~$4,00 0 for entire Sonde 1 minDiscrete or continuous measurements Requires use of computer, need to buy software Inaccurate setting by manufacturer, drift from original setting.")
14
DISSOLVED OXYGEN The amount of oxygen dissolved in water Aquatic organisms need oxygen to survive and grow Consequences of insufficient dissolved oxygen: Death of adults and juveniles Reduction of growth Failure of eggs/larvae to survive Change of species in given water body

15
Code (Note a) Principle DeviceResolutio n (@range) Cost (Note b) LaborLimitationsExtent of Error (Note c) DOCColorimetri c Reagent ampoules (Note c) and comparator (e.g., “CHEMets” by Chemetrics) 1 mg/l (1- 6) 2 mg/l (6- 12) $36/20 testsmeasure 3 min. 1 mg/l (1-4) 2 mg/l (4-8) 4 mg/l (8-12) DOCColorimetri c Reagent ampoules (Note d) and comparator (e.g., “AccuVac” by Hach) 0.2 mg/l (0-15) $78/25 testsmeasure 3 min. Leaky seal leads to continuous color development 1 mg/l DOWTitrimetricModified Winkler Method kit: DO bottle, reagents, vial and syringe for titration 0.2 mg/l (0-15) $50 /100 testsmeasure 8 min. “Sliding” endpoint. 0.5 mg/l DOEPolarograp hic D.O. meter+electrode0.05-0.2 mg/l (0-20) $800prep/calib. 1 h measure 0.5-3 min. Requires expertise and experience 5% DOP Polarographi c Rapid-Pulse probe, for Sonde (e.g., YSI or Hydrolab) 0.1 mg/l (0- 20) ~$4,000 for entire Sonde prep/calib. 2 h Downloa d 1 hr Requires expertise and experience 5%
 2 mg/l (4-8) 4 mg/l (8-12) DOCColorimetri c Reagent ampoules (Note d) and comparator (e.g., AccuVac by Hach) 0.2 mg/l (0-15) $78/25 testsmeasure 3 min. Leaky seal leads to continuous color development 1 mg/l DOWTitrimetricModified Winkler Method kit: DO bottle, reagents, vial and syringe for titration 0.2 mg/l (0-15) $50 /100 testsmeasure 8 min. Sliding endpoint. 0.5 mg/l DOEPolarograp hic D.O. meter+electrode mg/l (0-20) $800prep/calib. 1 h measure min. Requires expertise and experience 5% DOP Polarographi c Rapid-Pulse probe, for Sonde (e.g., YSI or Hydrolab) 0.1 mg/l (0- 20) ~$4,000 for entire Sonde prep/calib. 2 h Downloa d 1 hr Requires expertise and experience 5%.")
16
pH Measure of acidic vs. basic – strength of Hydrogen ion Lower value more acidic – Higher value more alkaline Aquatic organisms require narrow pH Extreme pH damages fish gills, exoskeleton, and fins Changes in pH may cause or change chemical reactions http://waltonfeed.com/old/soap/soaplit.html

17
Code (Note a) DeviceRangeResolution (pH units) CostLaborLimitationsExtent & Sources of Error (pH units) PHLQLiquid pH kit2-102$4 /50 tests 2 minDaylight only 2; Aging of indicator PHLQLiquid pH kit5-100.5$8 /50 tests 2 minDaylight only 1 Aging of indicator PHSTUniversal pH strip (Note b) 1-141$12 /100 tests 3 minDaylight only 1 Aging of indicator, slow response PHST“Environmental” pH strip (Note b) 5-100.5$12 /100 tests 3 minDaylight only 0.5 Aging of indicator, slow response PHST“Physiological” pH strip (Note b) 6.5-100.3$12 /100 tests 3 minDaylight only 0.3 Aging of indicator slow response r PHELPocket meter with dry electrode 1-140.1$6010 min cal, 3 min measure Need to rehydrate 0.3 Standard buffer drift, slow response PHELMulti-meter pH probe 1-140.1variable10 min cal, 3 min measure 0.3 PHPSonde/datalogge r probe 1-140.01~$4,000 for entire Sonde 10 min cal, 3 min measure 0.1
 DeviceRangeResolution (pH units) CostLaborLimitationsExtent & Sources of Error (pH units) PHLQLiquid pH kit2-102$4 /50 tests 2 minDaylight only 2; Aging of indicator PHLQLiquid pH kit $8 /50 tests 2 minDaylight only 1 Aging of indicator PHSTUniversal pH strip (Note b) 1-141$12 /100 tests 3 minDaylight only 1 Aging of indicator, slow response PHST Environmental pH strip (Note b) $12 /100 tests 3 minDaylight only 0.5 Aging of indicator, slow response PHST Physiological pH strip (Note b) $12 /100 tests 3 minDaylight only 0.3 Aging of indicator slow response r PHELPocket meter with dry electrode $6010 min cal, 3 min measure Need to rehydrate 0.3 Standard buffer drift, slow response PHELMulti-meter pH probe variable10 min cal, 3 min measure 0.3 PHPSonde/datalogge r probe ~$4,000 for entire Sonde 10 min cal, 3 min measure 0.1")
18
CONDUCTIVITY / SALINITY Conductivity is the ability of the water to conduct electrical current Salinity is a measure of the amount of salts in the water Salts (solids in dissolved form) break into positively and negatively charged ions Conductivity and salinity increase with the amount of salts in the water Salts affect the quality of water for drinking and irrigation Various species have specific salinity tolerances
 break into positively and negatively charged ions Conductivity and salinity increase with the amount of salts in the water Salts affect the quality of water for drinking and irrigation Various species have specific salinity tolerances")
19
Code (Note a) Principle DeviceRangeResolutionCostLaborApplicationsExtent & Sources of Error (percent of measured value) EC Electrical conductanc e Conductivit y meter 0 to 200 microS 1 microS$602 minSnowmelt, rainwater 5% uncompensated temperature effect Drift, source of Standard EC Electrical conductanc e Conductivit y meter 0 to1990 microS 10 microS$602 minFreshwater“ EC Electrical conductanc e Conductivit y meter 0 to19.90 miliS 100 microS (0.1 mS) $602 minFreshwater, Brackish water “ ECP Electrical conductanc e Sonde/data logger probe var ~$4,000 for entire Sonde 2 minall 5% Drift, source of Standard SAL Electrical conductanc e Salinity probe 2 to 40 ppt (Note b) variesPart of a package $800 or more Brackish and Seawater 5% Drift, source of Standard REF Refractive index Refractome ter 2-100 ppt (Note c) 1 or 2 ppt$1501 minBrackish, Seawater,hyp ersaline ponds 10% HYD Specific gravity Hydrometer16-40 ppt (Note d) 1 ppt$101 minBrackish and Seawater 10% HYD Specific gravity Hydrometer2-100 ppt1 ppt$30 (inc jar)3 minBrackish, Seawater,hyp ersaline ponds 55 Gravimetric Total dissolved solids (TDS) all0.1 mg/lLab method 55
 Principle DeviceRangeResolutionCostLaborApplicationsExtent & Sources of Error (percent of measured value) EC Electrical conductanc e Conductivit y meter 0 to 200 microS 1 microS$602 minSnowmelt, rainwater 5% uncompensated temperature effect Drift, source of Standard EC Electrical conductanc e Conductivit y meter 0 to1990 microS 10 microS$602 minFreshwater EC Electrical conductanc e Conductivit y meter 0 to19.90 miliS 100 microS (0.1 mS) $602 minFreshwater, Brackish water ECP Electrical conductanc e Sonde/data logger probe var ~$4,000 for entire Sonde 2 minall 5% Drift, source of Standard SAL Electrical conductanc e Salinity probe 2 to 40 ppt (Note b) variesPart of a package $800 or more Brackish and Seawater 5% Drift, source of Standard REF Refractive index Refractome ter ppt (Note c) 1 or 2 ppt$1501 minBrackish, Seawater,hyp ersaline ponds 10% HYD Specific gravity Hydrometer16-40 ppt (Note d) 1 ppt$101 minBrackish and Seawater 10% HYD Specific gravity Hydrometer2-100 ppt1 ppt$30 (inc jar)3 minBrackish, Seawater,hyp ersaline ponds 55 Gravimetric Total dissolved solids (TDS) all0.1 mg/lLab method 55")
20
TURBIDITY Amount of suspended particles including Algae, suspended sediment, and organic matter Suspended particles: Diffuse sunlight – reducing light Absorb heat – Increase temperature Clog fish gills Foul gravel beds Smother fish eggs and benthic insects

21
Code (Note a) PrincipleMethod name (Parameter, unit) CostLaborApplicationLimitation Extent & Sources of Error TransparencyMurkiness (Note b) None30 secTurbidity watch, source ID Not Applicable SECTransparencySecchi disk (Secchi depth, cm) ~$302 minStatus of Lakes and pools Need to deploy from above Daylight only 30%; Individual operator’s vision, Lighting, surface reflection, depth measurements TRTTransparencyTransparency tube (Transparency, cm) $405 minTurbidity in streams Source ID Daylight only 30%; Individual operator’s vision Length measurement, deposition TUJTransparency match Dual cylinder (Jackson turbidity, JTU) $405 minTurbidity in streams Source ID Daylight only 40%; Individual operator’s vision, quality of standard, volume measurements TUNLight-scatteringNephelometer (Turbidity, NTU) $300 and up 10 min cal 1 min measure Turbidity in streams and lakes, Source ID Error variable, depending on instrument TUNLight-scatteringAutomated Nephelometer (Turbidity, NTU) $1000 and up Installation, calibration, download. Use with data logger and/or trigger, storm events Fouling of light absorbing surfaces, drift from the calibrated state TSSGravimetric: Dry Weight per volume of sample aliquot (Note c) Filtration for Total Suspended Solids (TSS, mg/l) $2000 and up 20 minSediment loads assessments Requires laboratory facility Error variable, depending on operating procedures SSCGravimetric: Dry Weight per volume (by water weight) of whole sample Filtration for Suspended Sediment Concentration (SSC, mg/l) $2000 and up 20-60 minSediment loads assessments Requires laboratory facility Error variable, depending on operating procedures ICSinkingImhoff Cone Method ~$305 min (setup and read) Finer Separation by density Requires cones 30%; Lighting, surface identification, volume measurements
 Filtration for Total Suspended Solids (TSS, mg/l) $2000 and up 20 minSediment loads assessments Requires laboratory facility Error variable, depending on operating procedures SSCGravimetric: Dry Weight per volume (by water weight) of whole sample Filtration for Suspended Sediment Concentration (SSC, mg/l) $2000 and up minSediment loads assessments Requires laboratory facility Error variable, depending on operating procedures ICSinkingImhoff Cone Method ~$305 min (setup and read) Finer Separation by density Requires cones 30%; Lighting, surface identification, volume measurements.")
22
BEYOND THE FIVE BASIC VITAL SIGNS Nitrogen Large amount introduced creates excessive algal growth resulting in depleted dissolved oxygen Phosphate When amounts become elevated algal blooms can occur depleting dissolved oxygen

23
Bio-Assessment Survey of benthic aquatic macro invertebrates Survey of physical habitat

Similar presentations


 and dissolved.>")


