Download presentation
Presentation is loading. Please wait.

1
Landscape Ecosystems and Native Plant Communities Where we’ve been and where we’re going

2
Early efforts for the 1 st NE Landscape Plan ReportAuthorDate Range of Natural Variability in Forest Structure for the NSU Lee Frelich, UM, for FRCSept 1999 Native Plant Communities of the Northern Superior Uplands (Draft) Kurt Rusterholst, DNR Natural Heritage Program Nov 1999 Landscape Ecosystems for the NSU: Draft Map & Methods Mark White &George Host, NRRI Aug 2000 NSU 10 Year Growth StagesTerry Brown & Mark White2000 Northeast Landscape RNV Analysis White, Brown, HostJan 2001 1990-2002 Trend Assessment Brown & Host2006
 Kurt Rusterholst, DNR Natural Heritage Program Nov 1999 Landscape Ecosystems for the NSU: Draft Map & Methods Mark White &George Host, NRRI Aug 2000 NSU 10 Year Growth StagesTerry Brown & Mark White2000 Northeast Landscape RNV Analysis White, Brown, HostJan Trend Assessment Brown & Host2006")
3
Premises Understanding how different forest ecosystems respond to past disturbance is a key to understanding how they’ll behave in the future NSU contains communities that respond differently to disturbance – Northern Hardwoods – Red &White Pine – Aspen-birch-spruce-fir – Lowland Conifers

4
Landscape Ecosystems (Frelich) Identified late successional forest communities – Similar to but predates MN DNR Native Plant Community Classification Focus of Lee Frelich’s forest disturbance history work – Tree ring – Air photo – Canopy gap assessment Understand role of fire and wind in structuring different forest communities Based on Vegetation Growth Stages (VGS)
 Identified late successional forest communities – Similar to but predates MN DNR Native Plant Community Classification Focus of Lee Frelich’s forest disturbance history work – Tree ring – Air photo – Canopy gap assessment Understand role of fire and wind in structuring different forest communities Based on Vegetation Growth Stages (VGS)")
5
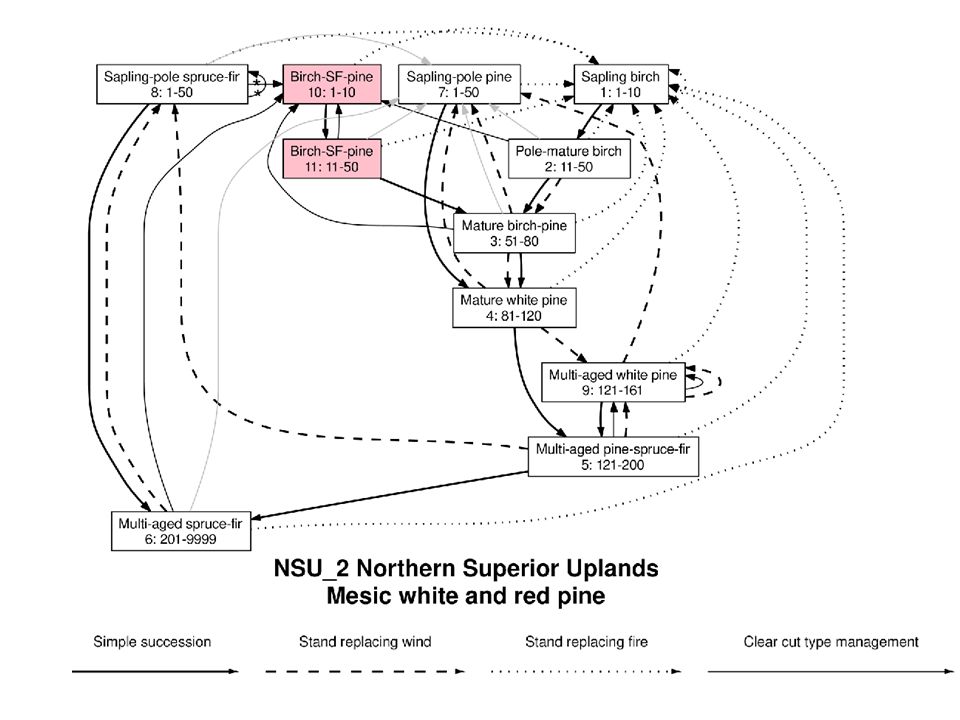
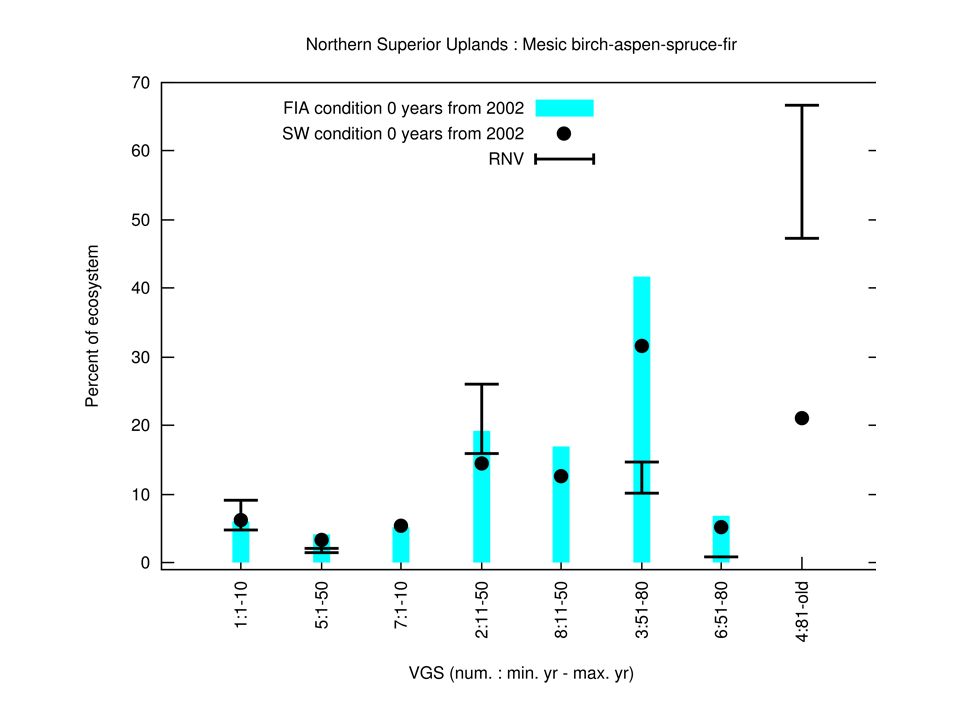
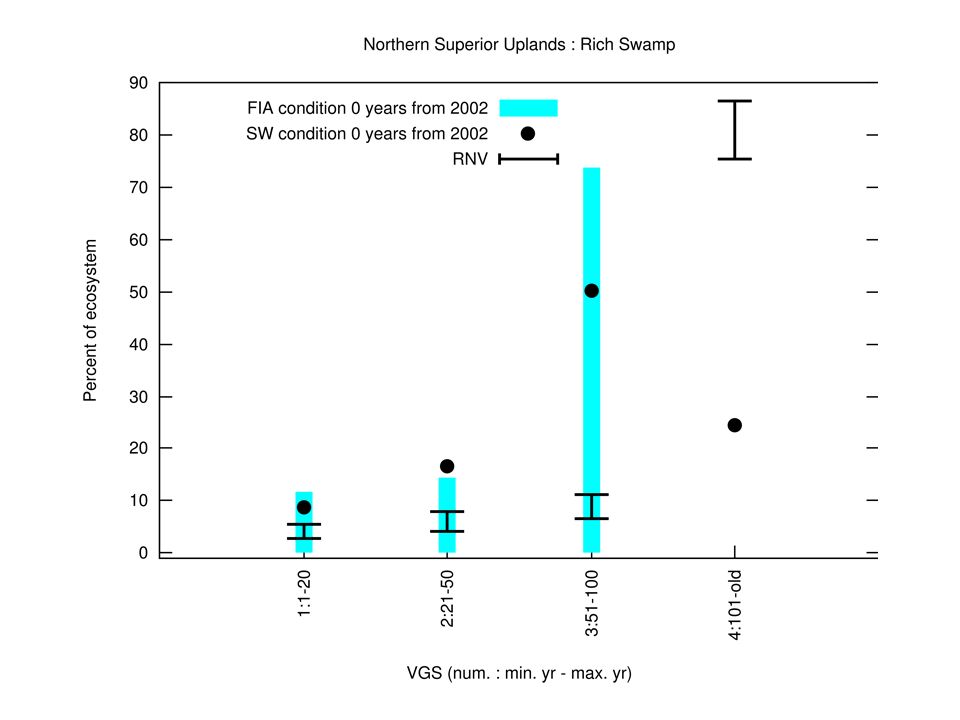
Vegetation Growth Stage An integration of forest development and forest succesional stages

6
Vegetation Growth Stage

9
Use of VGS models Understanding stand development and forest succession by landscape ecosystem can guide forest management – Manage for best use of a particular site Combined with ownership, allows an assessment of ‘who owns what?” But - need a map…

10
Mapping Landscape Ecosystem of the Northern Superior Uplands Approach: develop relationships between important GIS layers (soil, landform, climate) and forest inventory data Predict dominant late successional communities across the landscape White and Host 2000
 and forest inventory data Predict dominant late successional communities across the landscape White and Host 2000")
11
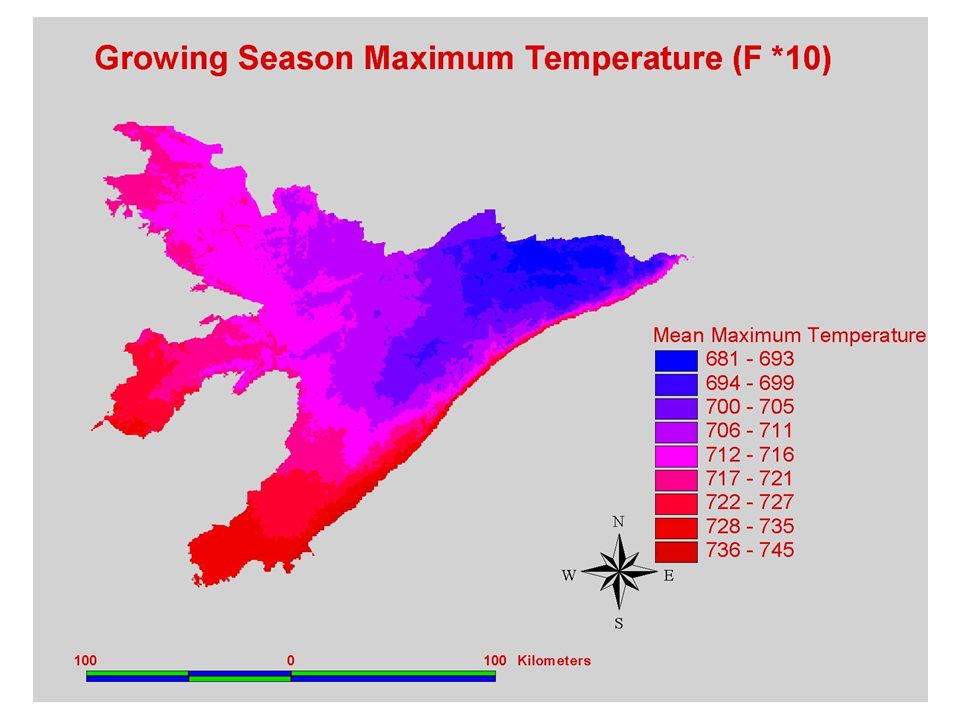
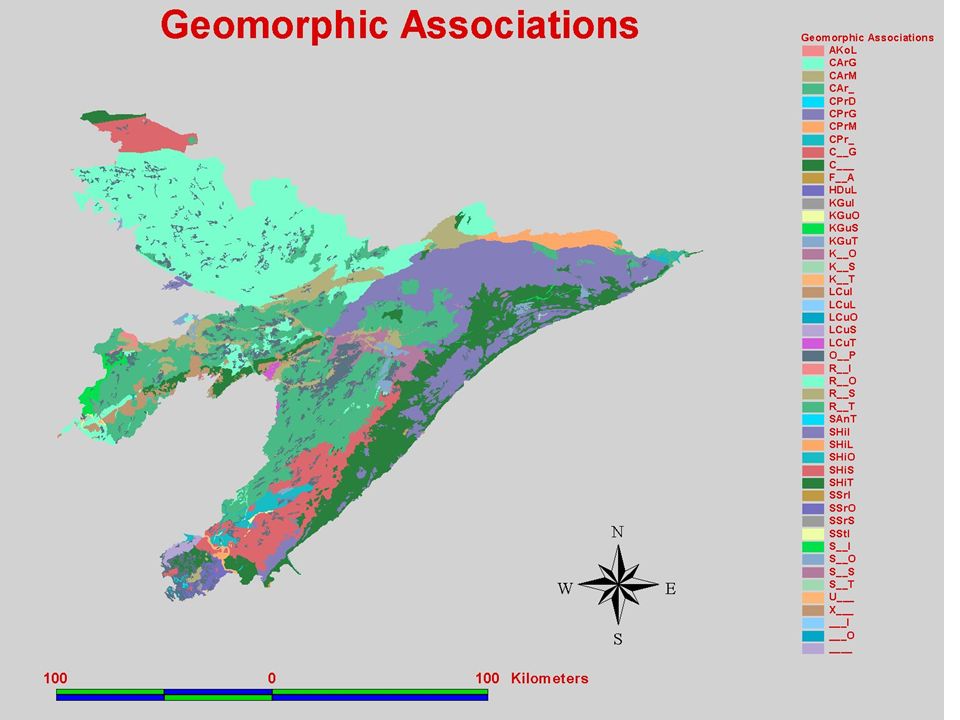
Environmental drivers influencing forest composition

15
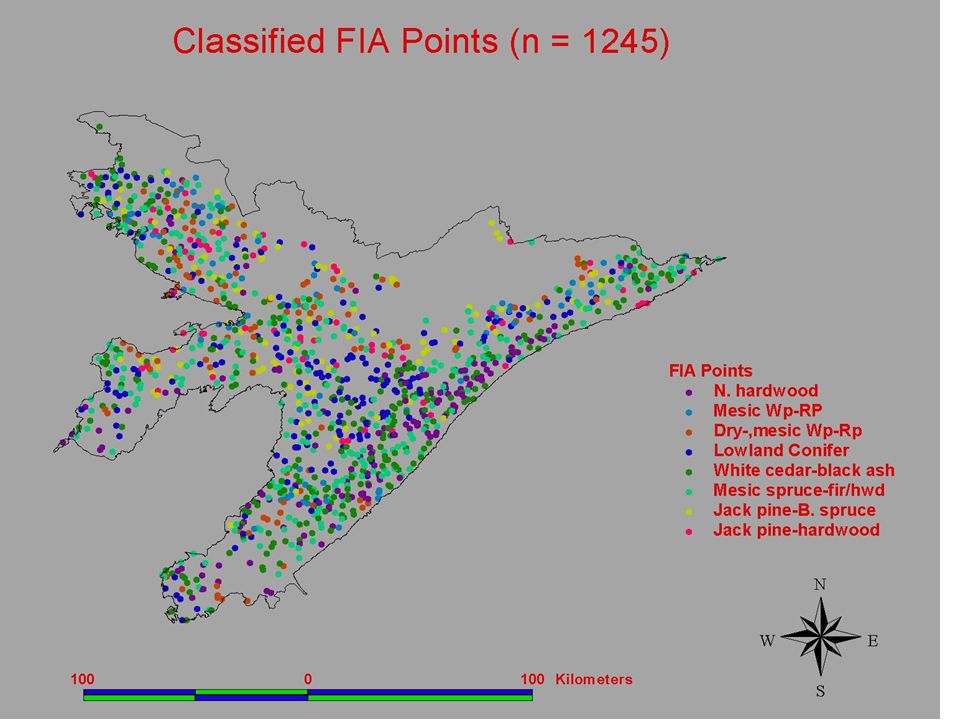
Spatial Modeling 1.Principal Component/Cluster Analysis to identify combinations of soil, landform & climate the recur in characteristic landscape positions 2.Identify statistical associations between landscape units and forest inventory plots

16
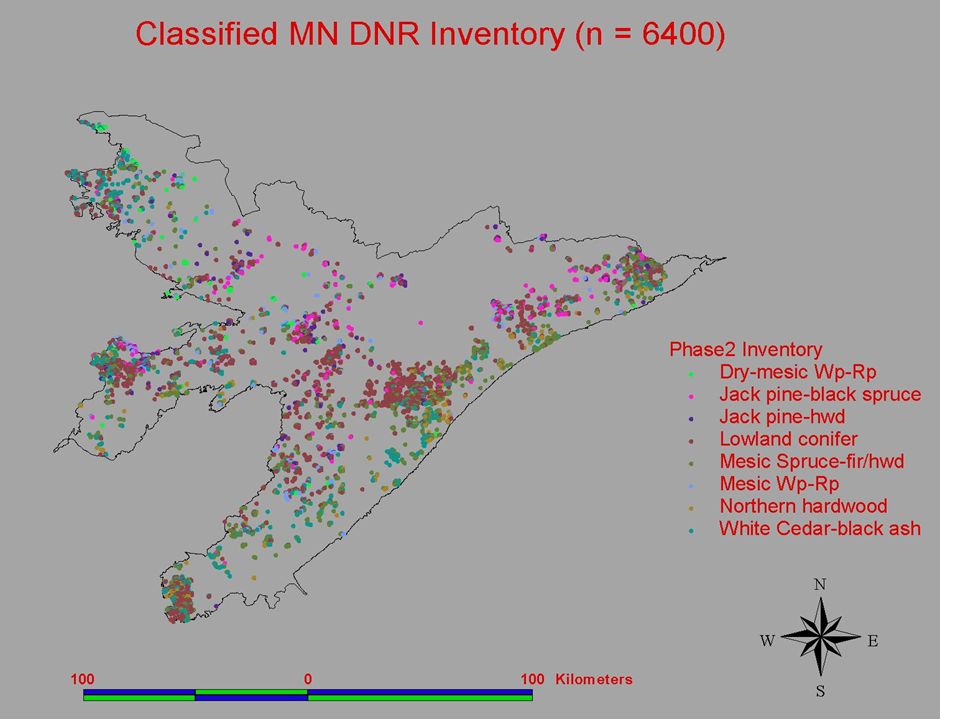
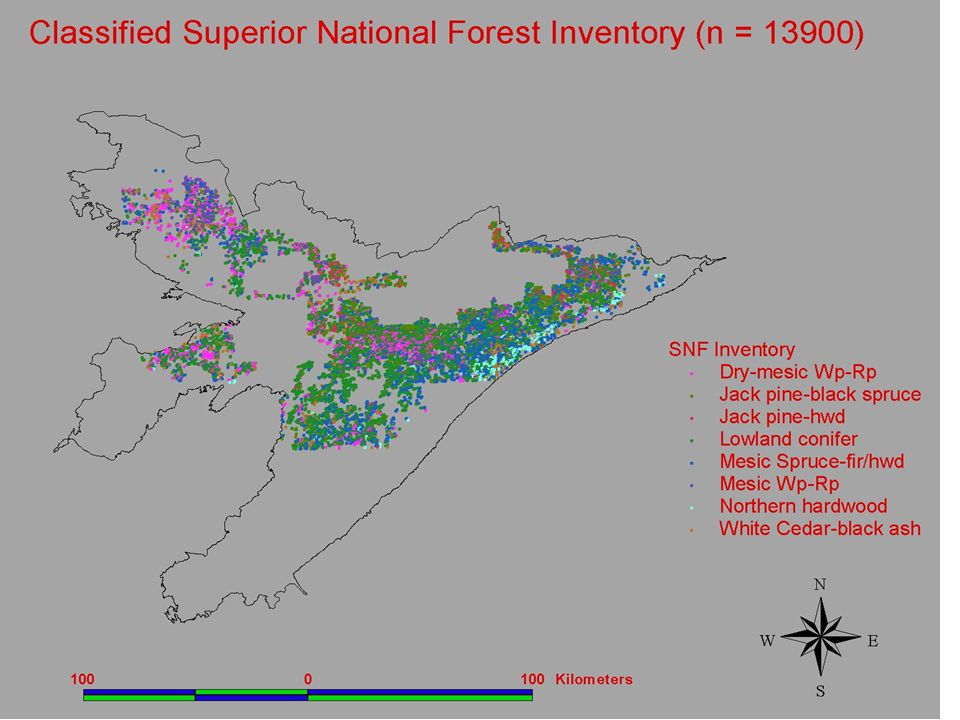
Forest Inventory Data Sources Attributes Used To Classify Inventory into Landscape Ecosystems Data Criteria N MN DNR Phase2 Inventory Relative Volume by Species Cover type Shrub/ground layer data Natural Regeneration Field Inventory Age >= 40 6400 FIA Remeasurement plots Relative Basal Area by species Cover type Natural Regeneration Field Inventory Age >= 40 1245 Superior National Forest Inventory Primary-secondary cover type Primary-secondary species Natural Regeneration Field Inventory Age >= 40 13900 Natural Heritage Program Releve plots Native Plant Community classification None298 GLO Bearing Tree Database Tree speciesSection corners > 2 bearing trees

20
Spatial Modeling Use cluster analysis to identify unique combinations of soil, landform, climate for the Northern Superior Uplands – Landscape Ecosystems Identify statistical associations between the Landscape Ecosystems and ~20000 Forest Inventory plots – Electivity Use these relationships to map potential Landscape Ecosystems entire landscape – Landscape Ecosystems – term used for Native Plant Communities prior to development of formal classification – Potential – map covers all lands, including those currently in urban, agricultural or other land use

21
NSU Landscape Ecosystems

22
MN DNR Native Plant Community Classification (2003) NPC: “A group of native plants that interact with each other and their environment” – Form recognizable units that repeat over space and time – Classified considering vegetation, hydrology, landforms, soils and natural disturbance regimes
 NPC: A group of native plants that interact with each other and their environment – Form recognizable units that repeat over space and time – Classified considering vegetation, hydrology, landforms, soils and natural disturbance regimes")
23
Native Plant Community has six hierarchical levels Uniform soil texture, moisture, topography, disturbance regimes Dominant canopy trees, Substrate, fine- scale differences in moisture and nutrients Group of NPCs unfied by a strong influence from major ecological processes

24
NPC System level Defined by – Plant indicators – Landform affinity – Soil & hydrology – Field characteristics Useful for landscape (30,000 foot) planning
 planning")
25
NPC Class level Defined by fine scale soil and moisture variables Higher resolution than System level Useful for local scale forest management planning

26
Landscape Ecosystems & Native Plant Communities Are they compatible? – Yes, with concerted group effort Mapping – same fundamental environmental data used in both systems – Map units of similar size to Minnesota-Ontario Peatlands effort Classification – Landscape Ecosystems roughly between System and Class level – Class-level assignments to LE map units can be made by incorporating GIS information or use of expert panels (or both!)
.")
27
Current NPC efforts The Drift and Lake Plains NPC map is at a coarser spatial resolution than the NSU or MOP Effort underway to map DLP and Western Superior Uplands with the same data sets and methods – Goal – a synoptic NPC map for the Laurentian Mixed Forest Same spatial resolution Same classification units

28
Questions & Comments?

29
Trends in Forest Composition & Spatial Pattern

30
Trends in Forest Composition 2006 – FRC (Dave Miller) requests a comparison of 1990 and 2002 forest inventory Which way are we heading? Conducted for DLP and NSU Sections

33
Update Highlights Many growth stages showed little change between the two inventories – 10 years relatively short time span – Smaller interval than most Vegetation Growth Stages Few FIA plots in old or multi-aged VGS categories FIA change of methods between 1990 -2003 confounds interpretation of data

34
Trends in Forest Disturbance Study – Quantify trends in disturbance frequency and size – Based on GLO survey and interpreted aerial photography from 1930s, 1970s 1990s – Covers 8 subsections in NSU and DLP White, M.A. and G.E. Host. 2008. Forest disturbance frequency and patch structure from pre-European settlement to present in the Mixed Forest Province of Minnesota, USA. Can. J. of Forest Research 38:2212-2226.

35
Trends in Forest Disturbance Results – Fire was the dominant disturbance 1860 - 1890 – 0.3-0.6% Annually – Border Lakes & Tamarack Lowlands highest frequencies – North Shore and Moraines low frequencies White, M.A. and G.E. Host. 2008. Forest disturbance frequency and patch structure from pre-European settlement to present in the Mixed Forest Province of Minnesota, USA. Can. J. of Forest Research 38:2212-2226.

36
Trends in Forest Disturbance Results – Fire was the dominant disturbance 1860 - 1890 – 0.3-0.6% Annually – Border Lakes & Tamarack Lowlands highest frequencies – North Shore and Moraines low frequencies White, M.A. and G.E. Host. 2008. Forest disturbance frequency and patch structure from pre-European settlement to present in the Mixed Forest Province of Minnesota, USA. Can. J. of Forest Research 38:2212-2226.

37
Trends in Forest Disturbance Results – Harvest has replaced fire as the dominant form of forest disturbance – 1910-1940 Large events in post settlement – 1970-1995 Even-aged management Smaller and more uniform patch sizes High edge density favors some wildlife species, reduces habitat for others White, M.A. and G.E. Host. 2008. Forest disturbance frequency and patch structure from pre-European settlement to present in the Mixed Forest Province of Minnesota, USA. Can. J. of Forest Research 38:2212-2226.

38
Segue to Lindberg & NLCD based change analysis

40
Applying Model Predictions to the Forest Landscape Run model at min and max estimates of disturbance frequencies to calculate the range of conditions (e.g. 10-20% of the ecosystem should be in pole size birch)
.")
Similar presentations


 Stands in the Central Appalachian Mountains Henri D. Grissino-Mayer¹, Charles W. Lafon²,>")

 Resource review Landcover data Watershed data FIA data.>")


 Rm. 2226, Bovey Building x53065 Dr. Rob Corry (Module.>")


