Download presentation
Presentation is loading. Please wait.

1
Bill Hardgrave (presenter) John Aloysius Sandeep Goyal Information Systems Department University of Arkansas
 John Aloysius Sandeep Goyal Information Systems Department University of Arkansas")
2
Bill Hardgrave John Aloysius Sandeep Goyal (presenter) Information Systems Department University of Arkansas
 Information Systems Department University of Arkansas")
3
Bill Hardgrave John Aloysius (presenter) Sandeep Goyal Information Systems Department University of Arkansas
 Sandeep Goyal Information Systems Department University of Arkansas")
4
Perpetual inventory (PI) record inaccuracy affects forecasting, ordering, replenishment PI is inaccurate on 65% of items (Raman et al. 2001) Simulation shows that inventory visibility provided 40 to 70% reduction in inventory cost (Joshi 2000) At any given time the retailer in this study manages about $32 billion in inventory
 Simulation shows that inventory visibility provided 40 to 70% reduction in inventory cost (Joshi 2000) At any given time the retailer in this study manages about $32 billion in inventory.")
5
Firms are skeptical about implementing new technologies based on pure faith, but need value assessments, tests, or experiments (Dutta, Lee, and Whang 2007) Such empirical-based research requires “a well-designed sample, with appropriate controls and rigorous statistical analysis”
 Such empirical-based research requires a well-designed sample, with appropriate controls and rigorous statistical analysis")
6
There is little empirical research in the field that demonstrates and quantifies the ability of RFID technology to improve inventory inaccuracy There is no empirical research that characterizes product categories for which RFID technology may be effective in reducing inventory record inaccuracy

7
Will RFID technology improve inventory accuracy in the environment of field conditions? Can RFID technology ameliorate the effects of known causal predictors of inventory inaccuracy? What are the characteristics of product categories for which RFID technology is effective in reducing inventory record inaccuracy?

8
Mechanisms which result in record inaccuracy Results in overstated PI? Results in understated PI? Can case-level RFID reduce the error? Incorrect manual adjustment Yes Improper returnsYes No Mis-shipment from DC Yes Cashier errorYes No PI: Perpetual InventorySource: Delen et al. (2007)
.")
9
Inventory visibility Retailer’s ability to determine the location of a unit of inventory at a given point in time by tracking movements in the supply chain Inventory record inaccuracy Absolute difference between physical inventory and the information system inventory at any given time (Fleisch and Tellkamp 2005) RFID-enabled auto-adjustment A system that leverages RFID technology to correct for the absolute difference between physical inventory and the inventory management system inventory at any given time
 RFID-enabled auto-adjustment A system that leverages RFID technology to correct for the absolute difference between physical inventory and the inventory management system inventory at any given time")
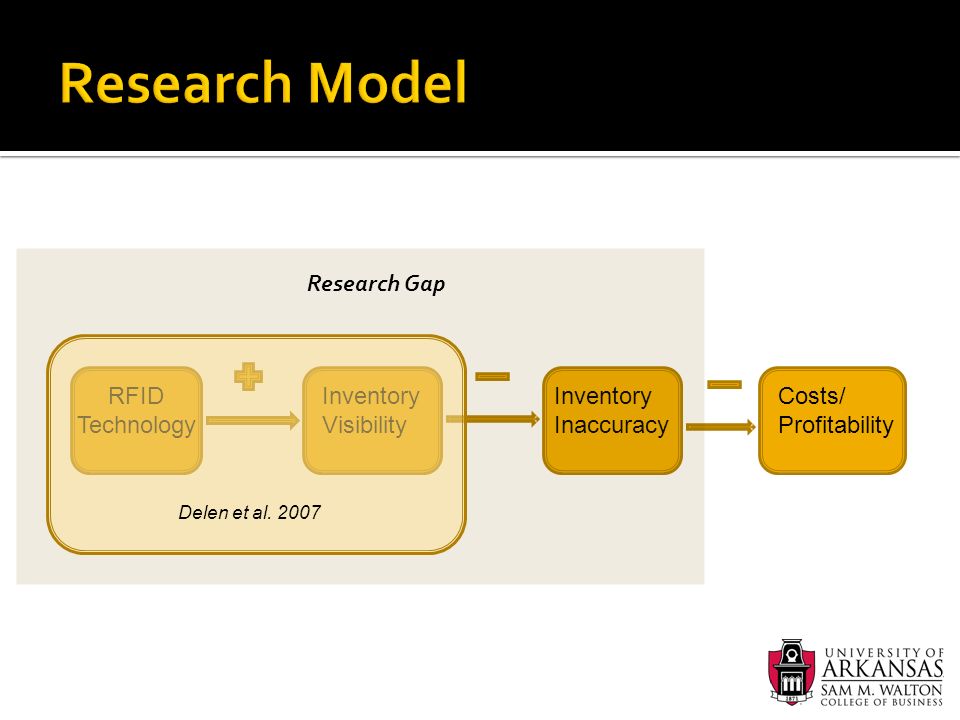
10
RFID Technology Inventory Visibility Inventory Inaccuracy Costs/ Profitability Research Gap Delen et al. 2007
11
RFID-enabled auto-adjustment will decrease inventory record inaccuracy over and above existing inventory management systems (IMS) IMS is the automated system that tracks the records of inventory on hand in the supply chain PI: Perpetual Inventory
 IMS is the automated system that tracks the records of inventory on hand in the supply chain PI: Perpetual Inventory")
12
Item level Item cost Sales volume Dollar volume sales Distribution structure Store level SKU variety Audit frequency Inventory density PI: Perpetual Inventory

13
RFID-enabled auto-adjustment will ameliorate the inventory record inaccuracy due to high sales volume, low item cost, high SKU variety, high dollar volume of sales, and inventory density PI: Perpetual Inventory

14
All products in air freshener category tagged at case level Data collection: 23 weeks 13 stores: 8 test stores, 5 control stores Mixture of Supercenter and Neighborhood Markets Daily physical counts 10 weeks to determine baseline Same time, same path each day

15
Looked at understated PI only i.e., where PI < actual Treatment: Control stores: RFID-enabled, business as usual Test stores: business as usual, PLUS used RFID reads (from inbound door, sales floor door, box crusher) to determine count of items in backroom ▪ Auto-PI: adjustment made by system ▪ For example: if PI = 0, but RFID indicates case (=12) in backroom, then PI adjusted – NO HUMAN INTERVENTION
 to determine count of items in backroom ▪ Auto-PI: adjustment made by system ▪ For example: if PI = 0, but RFID indicates case (=12) in backroom, then PI adjusted – NO HUMAN INTERVENTION")
16
Backroom Storage Sales Floor Door Readers Backroom Readers Box Crusher Reader Receiving Door Readers

17
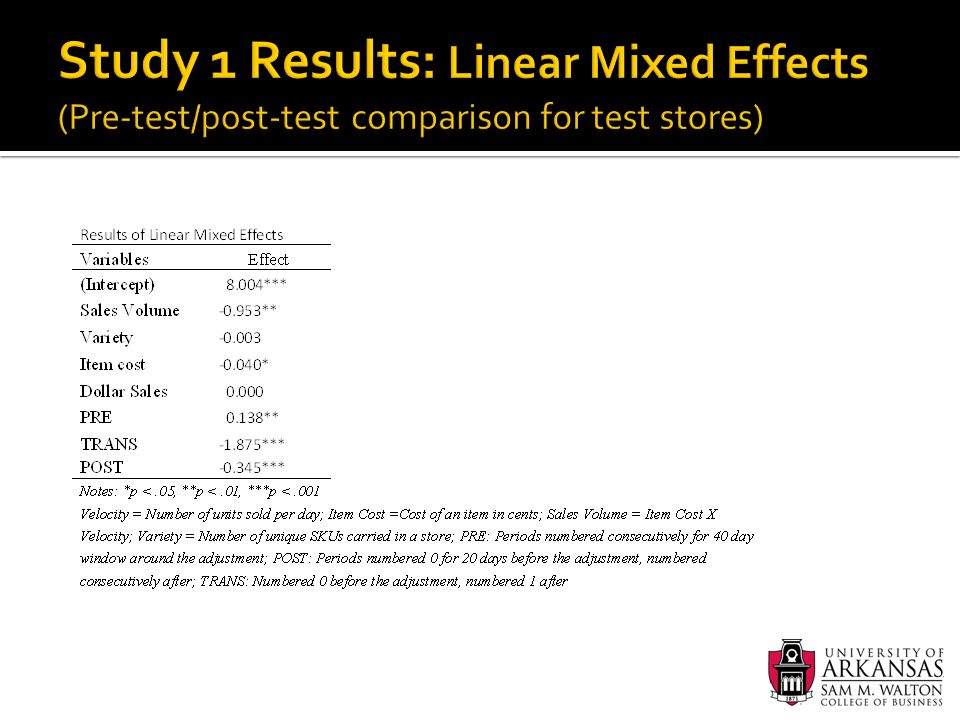
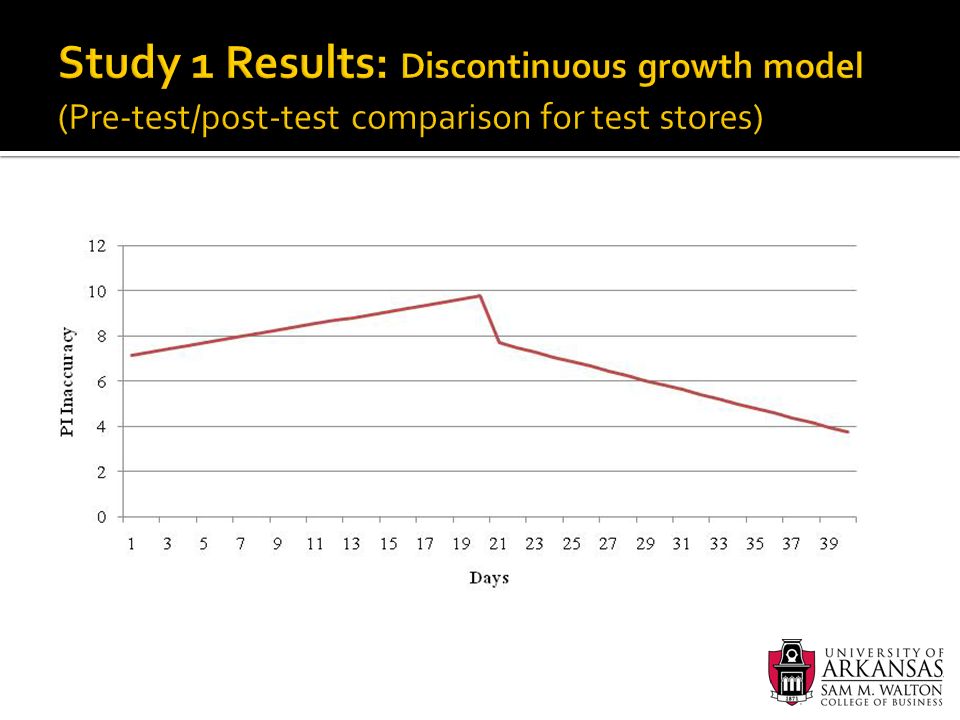
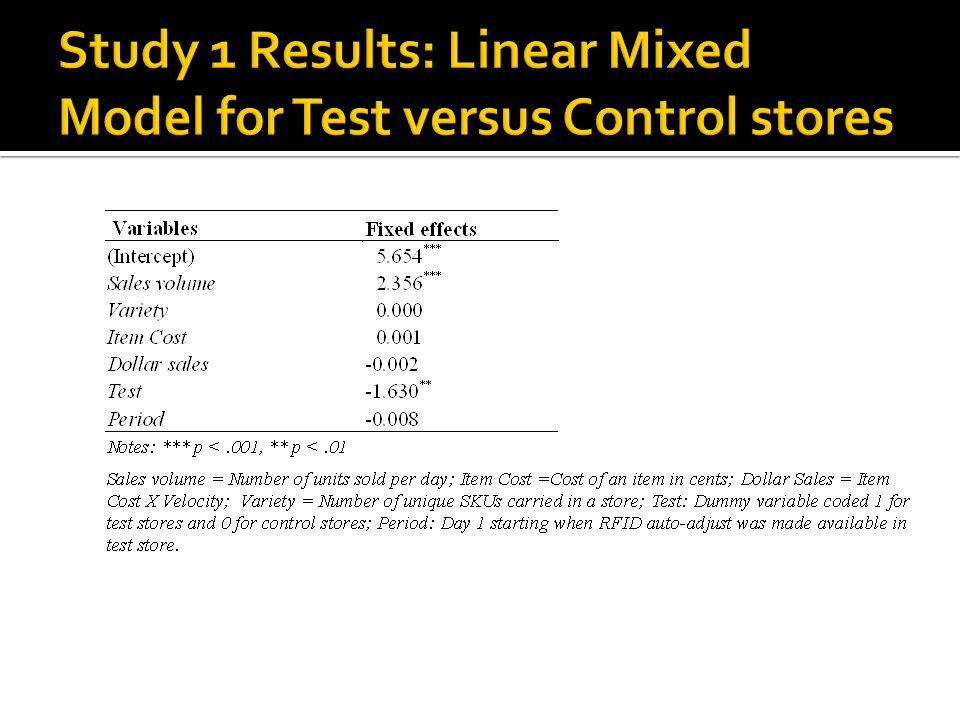
Two comparisons: Discontinuous growth model (Pre-test/Post-test) PI = b 0 + b 1 *PRE + b 2 *POST + b 3 *TRANS Linear mixed effects model (Test/Control) Random effect: Items grouped within stores Statistical software: R Hardware: Mainframe
 PI = b 0 + b 1 *PRE + b 2 *POST + b 3 *TRANS Linear mixed effects model (Test/Control) Random effect: Items grouped within stores Statistical software: R Hardware: Mainframe")
22
Matched Sample 62 stores: 31 test stores, 31 control stores Mixture of Supercenter and Neighborhood Markets Spread across the United States ▫ Control stores: RFID-enabled, business as usual ▫ Test stores: business as usual, PLUS used RFID reads (from inbound door, sales floor door, box crusher) to determine count of items in backroom Auto-PI: adjustment made by system For example: if PI = 0, but RFID indicates case (=12) in backroom, then PI adjusted PI: Perpetual Inventory
 to determine count of items in backroom Auto-PI: adjustment made by system For example: if PI = 0, but RFID indicates case (=12) in backroom, then PI adjusted PI: Perpetual Inventory")
23
Five general merchandise categories Floorcare e.g., Powerforce vacuum, tough stain pretreat, Woolite gallon Air freshener e.g., Glade plugin, Febreeze paradise, Glade oil Formula e.g., Pediasure chocolate, Nutripal vanilla Ready to assemble furniture e.g., computer cart, pedestal desk, executive chair Quick cleaners e.g., wood floor cleaner, Readymop, Swiffer floor sweeper PI: Perpetual Inventory

24
Data collection Two waves (Pre and Post implementation), two months apart Same time, same path each wave Stock physical counts conducted over 5 days in each wave by an independent company Dependent variable PI Absolute = | PI – Actual| Looked at both understated and overstated PI Pre-implementationPost-implementation RFID Implementation 5 days2 Months5 days
, two months apart Same time, same path each wave Stock physical counts conducted over 5 days in each wave by an independent company Dependent variable PI Absolute = | PI – Actual| Looked at both understated and overstated PI Pre-implementationPost-implementation RFID Implementation 5 days2 Months5 days")
25
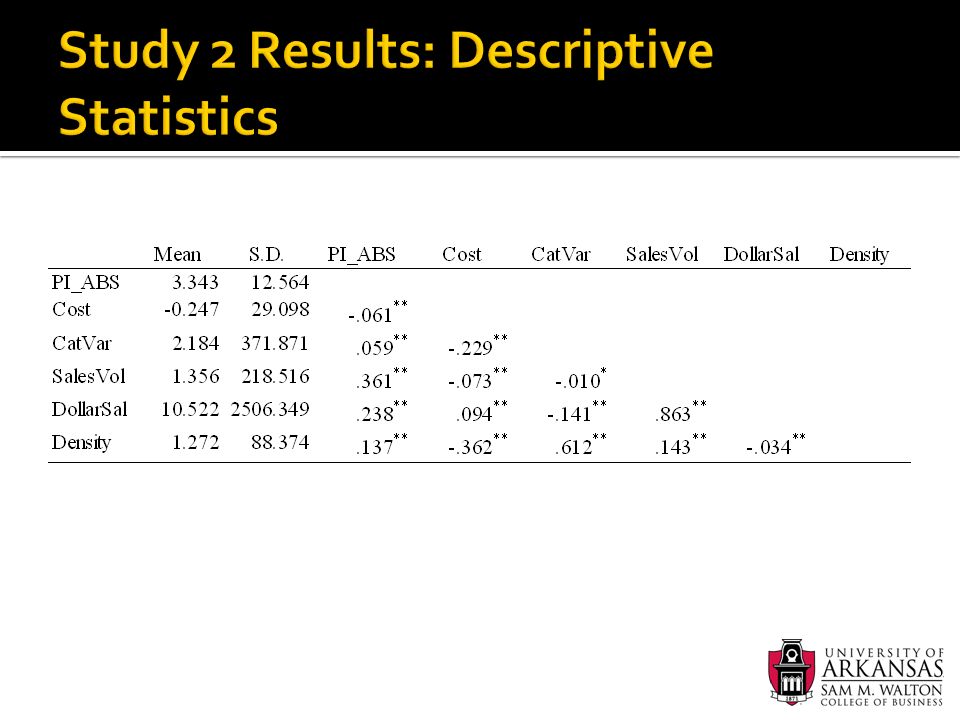
Data collection (contd.): Measures Item cost Cost of the item to the retailer Sales volume Quantity of item sold for two month preceding measurement Dollar sales Dollar amount of items sold for two month preceding measurement Density Total number of units in a category divided by linear feet of shelf space for that category Variety Total number of unique SKUs in a category PI: Perpetual Inventory
: Measures Item cost Cost of the item to the retailer Sales volume Quantity of item sold for two month preceding measurement Dollar sales Dollar amount of items sold for two month preceding measurement Density Total number of units in a category divided by linear feet of shelf space for that category Variety Total number of unique SKUs in a category PI: Perpetual Inventory")
26
Dependent variable: PI Absolute = |PI – Actual| Looked at both understated PI and overstated PI Treatment: ▫ Control stores: RFID-enabled, business as usual ▫ Test stores: business as usual, PLUS used RFID reads (from inbound door, sales floor door, box crusher) to determine count of items in backroom PI: Perpetual Inventory
 to determine count of items in backroom PI: Perpetual Inventory")
27
Comparisons: Linear mixed effects model (Pre-test/Post-test) Random effect: Items grouped within stores Statistical software: R Hardware: Mainframe
 Random effect: Items grouped within stores Statistical software: R Hardware: Mainframe")
29
PI~PERIOD + COST + SALESVOL + DOLLARSA + DENSITY + CATVAR + PERIOD_XXX

30
PI = β 0 + β 1 *Treatment Control Stores Test Stores Difference Floorcare-0.208*-0.899***0.691** Airfreshener-1.099*-2.729***1.63*** Furniture-0.061n.s.0.168n.s.-0.229n.s. Formula0.894n.s.-2.004***2.898*** Cleaners1.692**1.319**0.373**

31
*** < 0.01; ** < 0.05; * < 0.1 Sales Volume: Number of units sold per day Dollar Sales: Sales in dollars Inventory Density: Item Cost: Cost of an item in cents SKU Variety: Number of unique SKUs carried in a store

32
▫ RFID technology with case-pack tagging demonstrated to improve inventory inaccuracy by 23% ▫ Some evidence that RFID technology is effective in ameliorating the effects on inventory inaccuracy of item cost, sales volume, dollar sales, density, and variety PI: Perpetual Inventory

33
RFID technology is more effective in reducing PI inaccuracy in product categories which have greater SKU variety, high sales volume, higher dollar sales, lower cost, and greater inventory density

34
What is the economic impact of RFID? Imagine inventory accuracy with item-level tagging …

Similar presentations


 and confidential; do not distribute or cite without explicit permission.>")


