Download presentation
Presentation is loading. Please wait.

1
Communicating and Spreading Success Sponsored by: Health Quality Council of Alberta and Western Node of Safer Healthcare Now! February 1, 2007 Best Western Village Park Inn 1804 Crowchild Trail NW, Calgary, Alberta Foothills II Room 1 pm Welcome by Dr. John Cowell, CEO HQCA 1:15 – 2:45 pm Using Quarterly Reports Effectively! Virginia Flintoft, Project Manager, Central Measurement Team – Safer Healthcare Now! University of Toronto 2:45 – 3:00 pm BREAK 3:00 – 4:30 pm What Now? Sustaining and Spreading for Success Tanis Rollefstad, Improvement Advisor, Western Node for Safer Healthcare Now! 4:45 pm Mix and Mingle

2
www.hqca.ca Put title right in here March 15, 2004 Communicating and Spreading Success John W. Cowell, MD, FRCPC Chief Executive Officer February 1, 2007

3
www.hqca.ca HQCA has embraced and tangibly supported SHN since its inception Our focus is on health system quality, safety and performance We work primarily from the citizen’s point of view

4
www.hqca.ca We collaborate and work directly with all the health regions, professions and policy makers Our Template is the Alberta Quality Matrix for Health We believe effective performance management requires appropriate measurement at all levels

5
www.hqca.ca 1.55 teams enrolled in Alberta 2.There are teams working on each of the 6 SHN interventions 3.Alberta leads the west in providing data to the Central Measurement Team (CMT) What’s happening in Alberta
 What’s happening in Alberta")
6
www.hqca.ca 4.Over 90% of hospitals have submitted data to CMT 5.Analysis of the data will reveal whether the initiatives in each of the interventions result in improved clinical outcomes 6.It is anticipated the analysis and conclusions of this will ensure the spread of successful change What’s happening in Alberta (cont.)
")
7
www.hqca.ca We have no doubt those of you working hard on the interventions and collaborations are making a positive difference on the patient experience.

8
What can we learn from SHN’s Quarterly Reports? Virginia Flintoft, RN MSc SHN – Central Measurement Team

9
Objectives Overview of the Quarterly Report format Basic interpretation and caveats Intervention-specific observations Breakout + Quiz Questions

10
Quarterly Report format Q.R. #Date data submittedMonths reported 1April ’06 – June ’06Nov* ’05 – June ’06 2April ’06 – Sept. ’06Nov* ’05 – Sept. ’06 3April ’06 – Dec. ’06Nov* ’05 – Dec. ’06 * or preceding months pooled and reported in November

11
Quarterly Report format

12
AMI – 8 CLI – 3 Med Rec – 3 RRT – 3 SSI – 7 VAP – 2 Total = 26

13
Quarterly Report format

16
Goals: Vary for each measure Types Evidence based Based on local performance o AMI 8; CLI 1; MedRec 1 & 2; RRT 1; VAP 1 Set by team o RRT 2 & 3 Calculation method specified at bottom of Raw Data Sheet

17
Quarterly Report format Data Analyzed & Presented: Nationally by Node – Atlantic Ontario Quebec Western Paeds by Implementation Stage – Baseline Early Full

18
Quarterly Report format Your Job!!

19
Quarterly Report format Copy values in “Final Calculation” row on Raw Data Sheet and paste into “Local Team” row (r7) on Quarterly Report Raw Data Sheet from Measurement Workbook
 on Quarterly Report Raw Data Sheet from Measurement Workbook")
20
Copy values in “Final Calculation” row on Raw Data Sheet and paste into “Local Team” row (r7) on Quarterly Report
 on Quarterly Report")
21
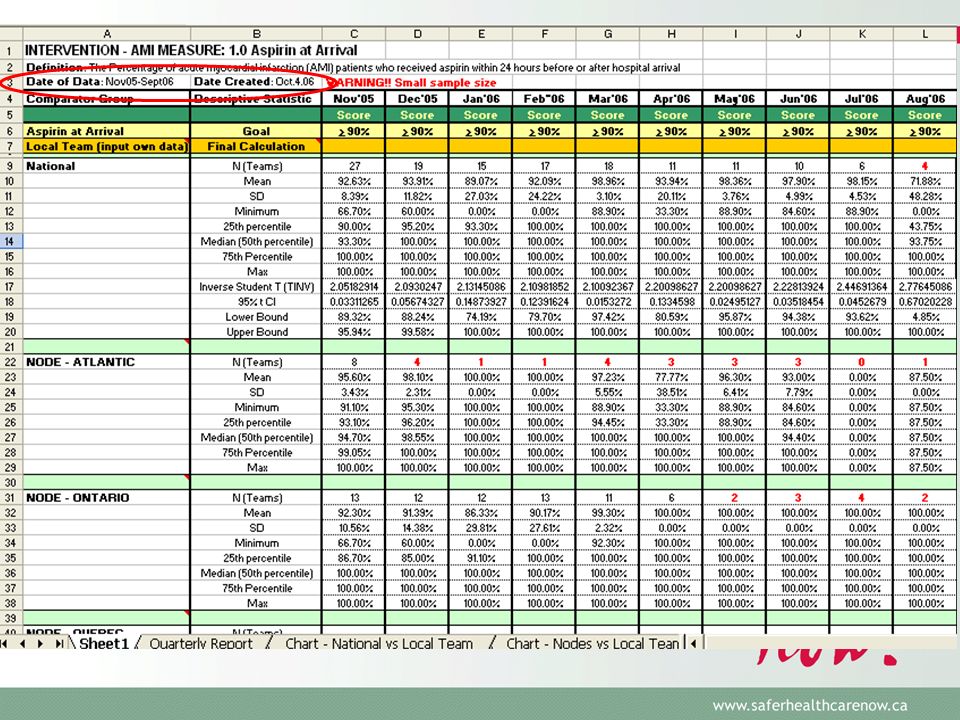
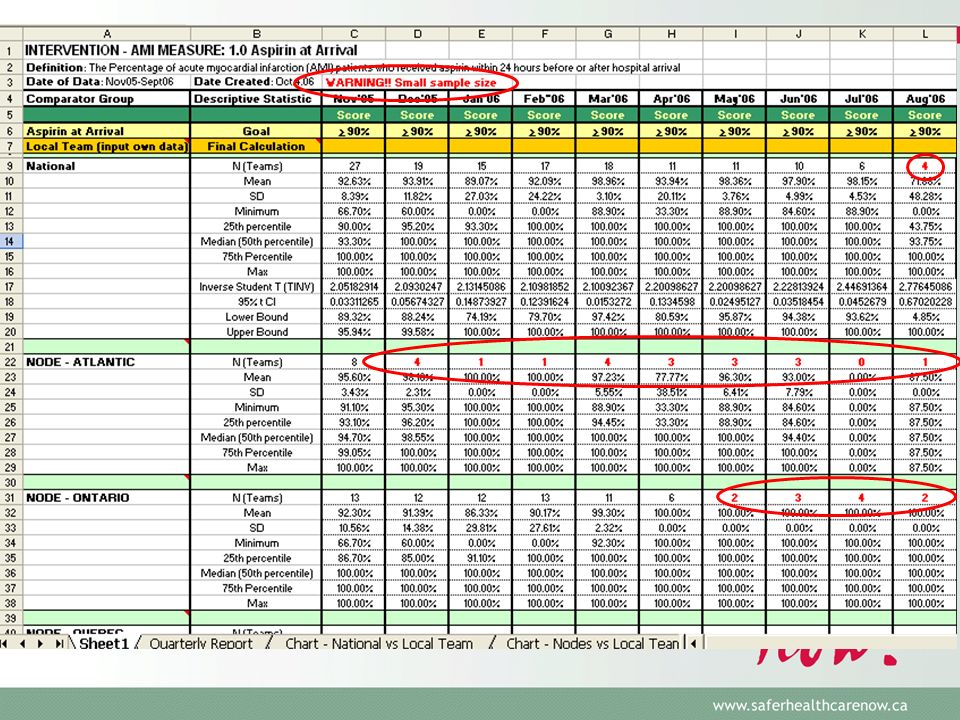
Definitions: “N (Teams)” = Number of teams reporting data for a specific month Caveats: When N (Teams) <5 the data is not stable due to too small a cell size The number of teams reporting per month varies with each QR Basic interpretation
 = Number of teams reporting data for a specific month Caveats: When N (Teams) <5 the data is not stable due to too small a cell size The number of teams reporting per month varies with each QR Basic interpretation")
22
Quarterly Report format QR #1 – data submitted April - June 2006 QR #2 – data submitted April - Sept. 2006 Data becomes more stable as sample size increases

23
Basic interpretation Definitions: “Mean” = average score for the measure for the hospitals reporting data for that month. Caveat: The more teams reporting the more stable the mean.

24
Basic interpretation Definitions: “SD” = standard deviation - summary value for how widely dispersed the scores are around the mean. In a normal distribution 95% of all scores are within 2-SDs on either side of the mean. Caveats: Very high SD indicates large variation in scores making it difficult to use the national average to interpret your performance. Normal curve has no defined limits - a ‘percentage’ is limited to 0 and 100. Therefore, 2-SDs above or below the mean may be >100 or <0.

25
To “Unhide” rows highlight 1or 2 rows above & below node ‘section’ right click to display menu select “unhide”

26
Minimum – lowest score reported for a specific month Maximum - highest score reported for a specific month 25 th percentile – 25% of all teams reporting data for that month have a lower score. Median (50 th percentile) – exactly half of the scores are above and below this value. 75 th Percentile - 75% of all teams reporting data for that month have a lower score. It is better to be <25 th percentile for some measures
 – exactly half of the scores are above and below this value. 75 th Percentile - 75% of all teams reporting data for that month have a lower score. It is better to be <25 th percentile for some measures.")
27
Bracketed measures (large): o Only included in National analysis o Used for calculating confidence intervals (CI) Bracketed measures (small): o Lower and Upper Bound = CI
: o Only included in National analysis o Used for calculating confidence intervals (CI) Bracketed measures (small): o Lower and Upper Bound = CI")
28
Interpretation: Compare your performance (Local Team) to National mean month-over-month Compare your performance to CI o if score falls between upper and lower bound = statistically similar (Jan., Feb., Apr.)
 to National mean month-over-month Compare your performance to CI o if score falls between upper and lower bound = statistically similar (Jan., Feb., Apr.)")
29
No CI because 25 th %ile - Max=100%

30
Adjust to appropriate level

32
Definitions of Implementation Stages Baseline Stage –Pre-intervention. Data collected for Baseline should be collected prior to implementing small tests of change and reflect the current process.

33
Definitions of Implementation Stages Early (Partial) Implementation Stage –The team has: set a clear aim(s) for this intervention (i.e. AMI, CLI, MedRec, RRT, SSI or VAP); identified which measures will indicate if the changes will lead to improvement; and started to implement small tests of change (PDSA) to identify and refine processes, procedures and practices which will lead to improvement and achieving the aim. When the team is close to goal they are ready to move to Full Implementation.
; identified which measures will indicate if the changes will lead to improvement; and started to implement small tests of change (PDSA) to identify and refine processes, procedures and practices which will lead to improvement and achieving the aim. When the team is close to goal they are ready to move to Full Implementation..")
34
Definitions of Implementation Stages Full Implementation Stage –The processes, procedures and practices are finalized and have lead to significant improvement. These practices on the selected unit are being consistently applied and monitored, showing a sustained performance at or close to goal. The team has achieved their aim(s) and is ready to spread to other areas.
 and is ready to spread to other areas..")
35
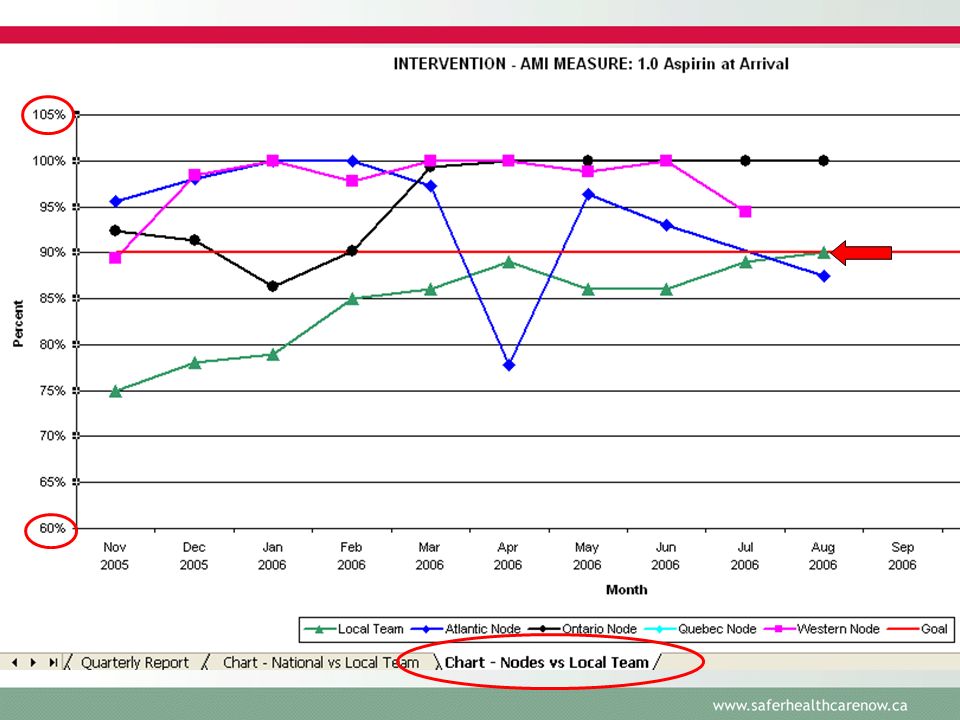
Interpretation: Compare your performance (Local Team) to National monthly means– match Implementation Stage (Baseline, Early, Full) Cut, Paste and Create an annotated Run Chart
 to National monthly means– match Implementation Stage (Baseline, Early, Full) Cut, Paste and Create an annotated Run Chart")
36
Cut & Paste

37
Annotated run chart

38
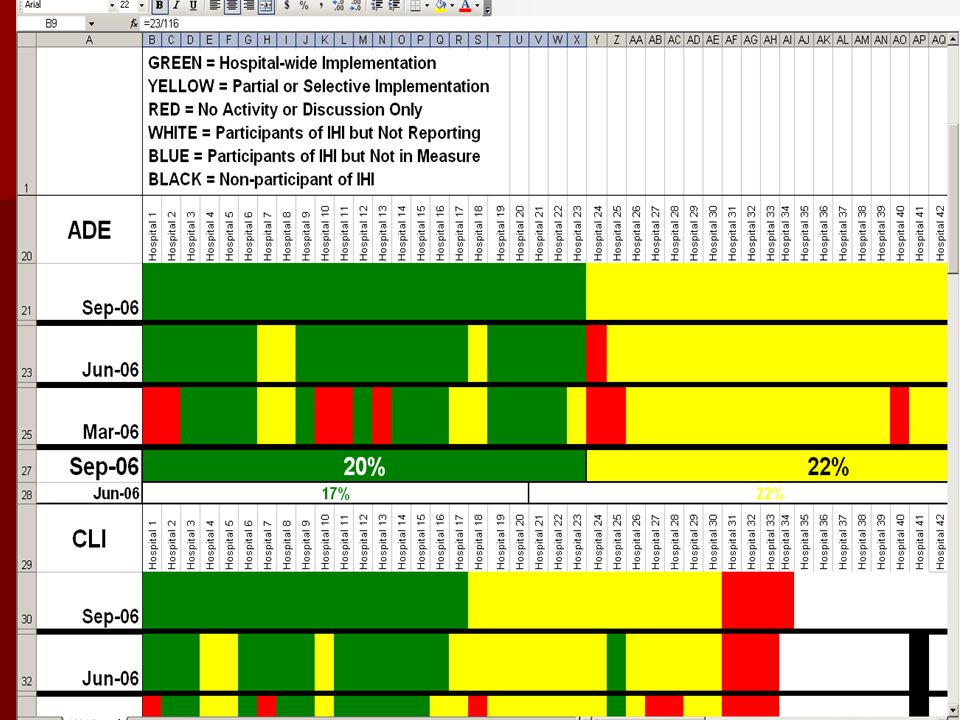
Data Submission and Performance Nov.30.06

39
Intervention-specific

40
National Intervention-specific (as of Nov.’06) AMI oASA on arrival (AMI 1) - at or >Goal oASA @ discharge (AMI 2) - at or >Goal oBeta Blocker @ discharge (AMI 3)- at or >Goal oACEi/ARB @ discharge (Ami 5)- at or >Goal oThrombolysis or Primary PCI at arrival (AMI 4a & 4b) small cell size, ++ variation, mean performance since May’06 (4A)40%-65% & (4B) 35%-75% oSmoking Cessation Counselling (AMI 6) mean performance 50%-75% - is documentation adequate?
 AMI oASA on arrival (AMI 1) - at or >Goal discharge (AMI 2) - at or >Goal oBeta discharge (AMI 3)- at or >Goal discharge (Ami 5)- at or >Goal oThrombolysis or Primary PCI at arrival (AMI 4a & 4b) small cell size, ++ variation, mean performance since May’06 (4A)40%-65% & (4B) 35%-75% oSmoking Cessation Counselling (AMI 6) mean performance 50%-75% - is documentation adequate")
41
National Intervention-specific (as of Nov.’06) AMI (cont.) oPerfect Care (AMI 7) issues related to exclusion criteria – transfer in and out oInpatient Mortality (AMI 8) – poor submission (only 2 teams since Sept) All AMI teams should submit monthly using “retrospective” form
 AMI (cont.) oPerfect Care (AMI 7) issues related to exclusion criteria – transfer in and out oInpatient Mortality (AMI 8) – poor submission (only 2 teams since Sept) All AMI teams should submit monthly using retrospective form")
42
National Intervention-specific (as of Nov.’06) CLI, RRT & VAP - ICU collaborative measures – oCLI data submission improved - 8-20 teams submitting data/mo. Bloodstream infection rate /1000 days (CLI 1) CLIs now used routinely outside ICU you may choose to expand inclusion beyond ICU Insertion Bundle (CLI 2) National mean performance 50% Early & Full Implementation 45%-80% Maintenance Bundle (CLI 3) Early & Full Implementation ~70%
 CLIs now used routinely outside ICU you may choose to expand inclusion beyond ICU Insertion Bundle (CLI 2) National mean performance 50% Early & Full Implementation 45%-80% Maintenance Bundle (CLI 3) Early & Full Implementation ~70%.")
43
National Intervention-specific (as of Nov.’06) CLI, RRT & VAP (cont.) oRRT data submission improved - 11-19 teams submitting data/mo Percent of codes outside of ICU (RRT 2) – 70%-90% + high SD Utilization Rapid Response Team (RRT 3) – 1-200 + high SD oVAP better submission Nationally (21-41 teams/month) VAP Bundle compliance (VAP 2) between 57-83% - goal=95% Be sure your teams are applying revised definition (CDC)
 CLI, RRT & VAP (cont.) oRRT data submission improved teams submitting data/mo Percent of codes outside of ICU (RRT 2) – 70%-90% + high SD Utilization Rapid Response Team (RRT 3) – high SD oVAP better submission Nationally (21-41 teams/month) VAP Bundle compliance (VAP 2) between 57-83% - goal=95% Be sure your teams are applying revised definition (CDC)")
44
National Intervention-specific (as of Nov.’06) Medication Reconciliation oExcellent rates of submission – 27 to 69 teams/mo. oIntentional Undocumented Discrepancies (MedRec 1) oMedian from 0.6 down to 0.26 oUnintentional Discrepancies (MedRec 2) oMedian ranges from 0.57 to 1.00 oLikely due to CCHSA requirement and Western Collaborative
 oMedian from 0.6 down to 0.26 oUnintentional Discrepancies (MedRec 2) oMedian ranges from 0.57 to 1.00 oLikely due to CCHSA requirement and Western Collaborative.")
45
National Intervention-specific (as of Nov.’06) Surgical Site Infection oExcellent rates of submission likely due to Western Collaboration Timely Prophylactic Antibiotic (SSI 1) Appropriate prophylactic antibiotic (SSI 2) Appropriate Hair Removal (SSI 4) Appropriate selection of prophylactic antibiotic (SSI 7) oGlucose control for Major Cardiac (SSI 5) – 3 to 5 sites / month oGlucose control applicable beyond Major Cardiac – IMH oNormothermia (SSI 6) – 60% to 70%
 Surgical Site Infection oExcellent rates of submission likely due to Western Collaboration Timely Prophylactic Antibiotic (SSI 1) Appropriate prophylactic antibiotic (SSI 2) Appropriate Hair Removal (SSI 4) Appropriate selection of prophylactic antibiotic (SSI 7) oGlucose control for Major Cardiac (SSI 5) – 3 to 5 sites / month oGlucose control applicable beyond Major Cardiac – IMH oNormothermia (SSI 6) – 60% to 70%")
46
National Intervention-specific (as of Nov.’06) Surgical Site Infection (cont.) oStrong move to full implementation oPercent Clean Surg w/ Surgical Infection (SSI 3) Low submission rate likely due to difficulty monitoring SSI oAppropriate selection of Prophylactic antibiotics (SSI-7) – to be revised by SSI faculty
 Surgical Site Infection (cont.) oStrong move to full implementation oPercent Clean Surg w/ Surgical Infection (SSI 3) Low submission rate likely due to difficulty monitoring SSI oAppropriate selection of Prophylactic antibiotics (SSI-7) – to be revised by SSI faculty")
47
Sharing the Quarterly Reports With who do you (KOCs + Team Leaders) share the QR info? –Team, Sr. Mgmt, Board What should you tell each group?

48
Breakout Groups 1.Complete the quiz together 2.Determine the message(s) for your assigned group (i.e. Team, Sr. Mgmt, Board) 3.Report back
 3.Report back.")
49
Questions? Thank you for your interest in SHN! Contact Information: NameVirginia Flintoft AddressUniversity of Toronto Phone/email416-946-8350 virginia.flintoft@utoronto.ca

50
Safer Healthcare Now! Western Node Sustaining and Spreading for Success T. Rollefstad SIA Western Node February 1 & 2, 2007

51
Purpose Participants will be able to: Understand the principles of sustainability and spreading successful initiatives Understand the principles of sustainability and spreading successful initiatives Identify how spread elements can be applied in a local setting Identify how spread elements can be applied in a local setting Select strategies to enhance sustainability and spread in their local organization Select strategies to enhance sustainability and spread in their local organization

52
Definition of Sustainability The Modernisation Agency’s working definition of sustainability is: when new ways of working and improved outcomes become the norm. when new ways of working and improved outcomes become the norm. holding the gains and evolving as required, definitely not going back. holding the gains and evolving as required, definitely not going back. How to Spread Good Ideas: A systematic review of the literature on diffusion, dissemination and sustainability of innovations in health service delivery and organisation Report for the National Co-ordinating Centre for NHS Service Delivery and Organisation R & D (NCCSDO) April 2004 prepared by Trisha Greenhalgh, Glenn Robert, Paul Bate University College London; Olympia Kyriakidou, Fraser Macfarlane University of Surrey; Richard PeacockUniversity College London
 April 2004 prepared by Trisha Greenhalgh, Glenn Robert, Paul Bate University College London; Olympia Kyriakidou, Fraser Macfarlane University of Surrey; Richard PeacockUniversity College London.")
53
Definition of Spread Spread is the extent to which learning and change principles have been adopted in other parts of the organisation that could benefit from them. Spread is the extent to which learning and change principles have been adopted in other parts of the organisation that could benefit from them. Improvement knowledge generated anywhere in the healthcare system becomes common knowledge and practice across the healthcare system. Improvement knowledge generated anywhere in the healthcare system becomes common knowledge and practice across the healthcare system. NHS Modernization Agency 2003

54
The “Tipping Point” “The name given to that one dramatic moment in an epidemic when everything can change all at once.” - M. Gladwell “The part of the diffusion curve from about 10 percent to 20 percent adoption is the heart of the diffusion process. After that point, it is often impossible to stop the further diffusion of a new idea, even if one wished to do so.” - E. Rogers

55
The “Diffusion Curve” “tipping point”

56
Innovators Early Adopters Early Majority Late Majority Laggards 2.5% 13.5%34% 16% from Rogers, 1995 Adopter Categories

57
7 Deadly Sins of Spread! The things we’ve learned NOT to do: 1. Start with a large pilot area – Go Big or Go Home 2. Find one person to do It ALL 3. Be vigilant and work harder Roger Resar, MD & Carol Haraden, PhD

58
4. If it works in the pilot Unit, DON’T change it for spread 5. Appoint the successful team leader as the driver for spread to the WHOLE hospital 6. Look at the deficits on a quarterly basis 7. Early on expect marked improvement in hospital wide outcomes http://www.ihi.org/NR/rdonlyres/BF88C0E6-6E30-42FB-9CAF- 88B76B53EBE4/0/Haraden_Resar7SpreadlySins.ppt

59
Assessed for Risk of Hypothermia

60
Positive Conditions For Spread

61
Synthesized findings on major improvement initiatives in the UK Synthesized findings on major improvement initiatives in the UK Describes the main factors found to contribute to successful spread and sustainability Describes the main factors found to contribute to successful spread and sustainability

63
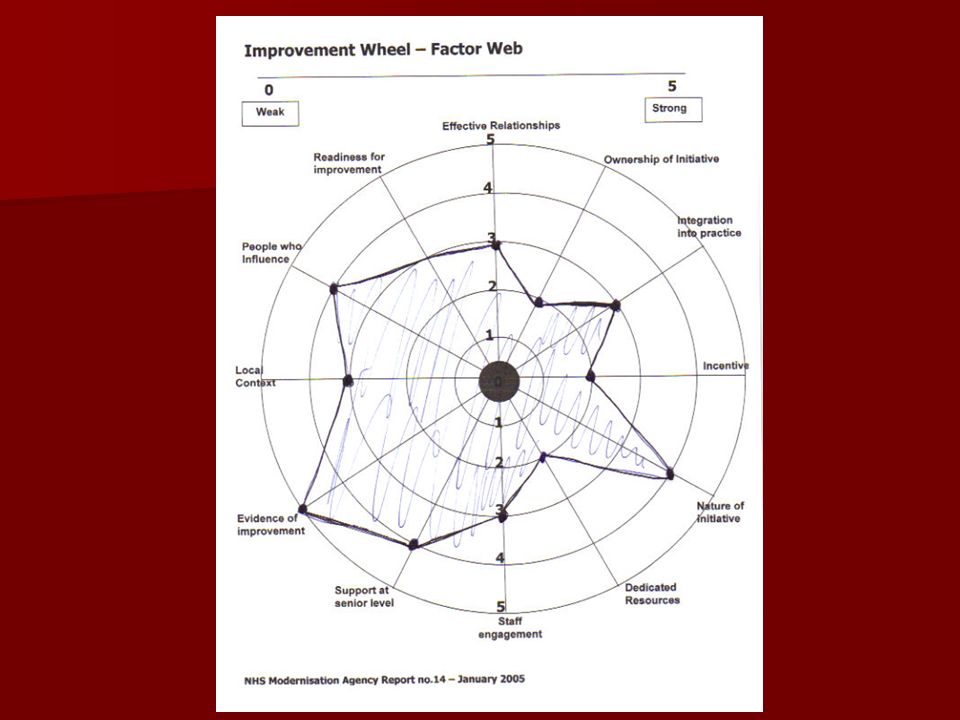
Factors Affecting Spread Ownership of the initiative Ownership of the initiative Effective Relationships Effective Relationships People who influence People who influence Leadership Leadership Dedicated resources Dedicated resources Process of implementation Process of implementation Incentives Incentives Staff Engagement Staff Engagement Support at senior level Support at senior level Local context Local context Nature of initiative Nature of initiative Readiness for Improvement Readiness for Improvement Evidence of Improvements Evidence of Improvements Integration into practice Integration into practice

64
Where are you at? Assessment Activity

65
Activity Think of one area you will spread to next Think of one area you will spread to next Using the FACTOR WEB Tool: Take 10 minutes to rate each of the Factors affecting spread Take 10 minutes to rate each of the Factors affecting spread 0= weak 5=strong 0= weak 5=strong Place a dot on the circle which intersects the factor line Place a dot on the circle which intersects the factor line Join the dots and shade the inner area Join the dots and shade the inner area

67
“ Real improvement comes from changing systems, not changing within systems.” – Berwick

68
Testing versus Implementation Testing – trying and adapting alternatives under multiple conditions Testing – trying and adapting alternatives under multiple conditions Implementation – making a change part of the day to day operation of the system Implementation – making a change part of the day to day operation of the system No implementation should fail

69
Creating a New System Hold the Gains Spread Improvement (test, implement)
")
70
Strategies to Hold the Gains I. During testing Replicate gains under a variety of conditions Replicate gains under a variety of conditions –Test the changes under a wide range of conditions (robust design) –Judgment samplings –Planned groupings Foolproof the new process/procedure Foolproof the new process/procedure –Reduce likelihood of mistake/error –Use short feedback loops –Use technology where appropriate
 –Judgment samplings –Planned groupings Foolproof the new process/procedure Foolproof the new process/procedure –Reduce likelihood of mistake/error –Use short feedback loops –Use technology where appropriate.")
71
Hold the Gains: II. During Implementation Seek and use input from others Seek and use input from others Use multiple PDSA cycles to implement the change Use multiple PDSA cycles to implement the change Collect data over time when conditions are expected to change Collect data over time when conditions are expected to change Redesign support processes for new process Redesign support processes for new process Address the social aspects of change Address the social aspects of change

72
Hold the Gains: III. After Implementation Old System New System Old System New System Some Inhibitors “We met our goals” “We met our goals” “We assumed the improvement would hold” “We assumed the improvement would hold” Other priorities took all resources away Other priorities took all resources away (not on senior management’s radar screen) No strategies or did not learn how to hold the gains No strategies or did not learn how to hold the gains Infrastructure not in place Infrastructure not in place Isolated project with a start and finish Isolated project with a start and finish
 No strategies or did not learn how to hold the gains No strategies or did not learn how to hold the gains Infrastructure not in place Infrastructure not in place Isolated project with a start and finish Isolated project with a start and finish.")
73
Key Components to Hold the Gains After Implementation Communication Communication Infrastructure Infrastructure Effective Control System Effective Control System Integrate into organization Integrate into organization Regular communication Informed with data Support processes Leadership acountability Continue measuring Keep Core principles but allow customization based on real issues Formalize documents Embed in orientations

74
Creating a New System Hold the Gains Spread Improvement (test, implement)
")
75
Readiness to Begin Spreading Changes There are demonstrated results from Collaborative team There are demonstrated results from Collaborative team There is will to spread the work of the Collaborative in the organization There is will to spread the work of the Collaborative in the organization Ensure strategy is a key initiative for the organization Ensure strategy is a key initiative for the organization A senior leader is responsible for spread of the changes A senior leader is responsible for spread of the changes

76
Adoption is a DOING thing! “BETTER IDEAS” Happens over time COMMUNICATED Thru a SOCIAL system Adapted from Rogers, 1995 In a concrete targeted way (C) 2001, Sarah W. Fraser
 2001, Sarah W. Fraser.")
77
Spread Model Infrastructure, Leadership and Measurement Better Ideas Information about the Innovation and “Transfer Materials” Target Populatio n “To and Through a Social System” Communicated Modes Purpose Messengers Based on materials from IHI and Veteran’s Health Administration

78
What the Improvement Team Can Do to Help with Spread Help to make the case for change Help to make the case for change Make it easier for others to do the work Make it easier for others to do the work Develop the messengers Develop the messengers

79
Attributes of the Change that Affect the Rate of Adoption Relative advantage Relative advantage Compatibility with current system Compatibility with current system Simplicity of the change and transition Simplicity of the change and transition Testability of the change Testability of the change Ability to observe the change and its impact Ability to observe the change and its impact

80
Spread Check List – Better Ideas that Spread Quickly We address the innovations’: –Relative advantage (it is better than alternative) –Trialability (you can test it first) –Observability (you can see it) –Compatibility with current values (it fits) –Simplicity (it’s simple to understand and do) Source: Diffusion of Innovations, Everett Rogers 1995
 –Trialability (you can test it first) –Observability (you can see it) –Compatibility with current values (it fits) –Simplicity (it’s simple to understand and do) Source: Diffusion of Innovations, Everett Rogers 1995")
81
Spread Check List – Better Ideas We can describe our changes (what), why the changes were made and benefits to patients and staff (tell the story) We can easily show our successes and results (show the data) We have documented our story through storyboards, presentations, newsletters, seminar materials, reports to senior leaders, videos, engaging stories, FAQ’s etc. We continually assess the value and quality of our transfer materials

82
Communication Plan Awareness of the initiative Awareness of the initiative –Document benefits –Show comparative data –Use multiple communication channels Technical knowledge Technical knowledge –Explain changes succinctly –Involve successful units in providing technical support –Train your messengers

83
Spread Check List – Communication We have used multiple channels for communication, focusing on interactive, peer-to- peer and face-to-face methods We communicate early and often We have identified our messengers, our connectors and “salespeople” We have trained our staff and provided them with the tools to tell the story

84
Spread Check List – Developing the Messengers We have chosen the right messengers –Trusted –Technically competent –Full member of local group We have used a two – step approach –From team to opinion leaders and connectors –From opinion leaders and connectors to their networks We have adequately educated the messengers to deliver the message

85
Social System Content, context, and community Content, context, and community –Understand the relevant circumstances affecting peoples’ ability/willingness to adopt the changes –Take advantage of the existing relationships within the system –Develop “communities of practice” among those with similar roles

86
Some Things to Consider about the Social System Some Things to Consider about the Social System “Behavior change is not just about action” (Prochaska) “Behavior change is not just about action” (Prochaska) What is the plan to integrate adopters willing to get involved? What is the plan to integrate adopters willing to get involved? What are the peer-to-peer opportunities? What are the peer-to-peer opportunities?

87
Plan to Reach all Units in Target Population Identify who will make the adoption decision (individuals, practice group, department, facility, etc) Identify who will make the adoption decision (individuals, practice group, department, facility, etc) Consider the following in planning the sequence for spread Consider the following in planning the sequence for spread –Coverage versus completeness –How best to optimize the learning with the addition of new units –Relationship of the units to the pilot sites –Champions exist or can be developed –Availability of resources
 Identify who will make the adoption decision (individuals, practice group, department, facility, etc) Consider the following in planning the sequence for spread Consider the following in planning the sequence for spread –Coverage versus completeness –How best to optimize the learning with the addition of new units –Relationship of the units to the pilot sites –Champions exist or can be developed –Availability of resources")
88
Spread Check List – Target Population & Social System We have identified our target population and spread community We have tried to understand context of our target population We have identified existing relationships, opinion leaders, innovators and early adopters in the target population We have allowed the target population to adapt our changes to fit their environment

89
Leadership’s Role in Spread Leadership Leadership –Topic is a key strategic initiative –Executive sponsor assigned –Day-to-day managers identified –Goals and incentives are aligned Set-up for spread Set-up for spread –Target population –Are pilot sites successful? –Identify key groups who make adoption decision –Initial strategy to reach all sites

90
Topic as a Key Strategic Initiative CCHSA – Medication Reconciliation is a Required Organizational Practice CCHSA – Medication Reconciliation is a Required Organizational Practice CCS – Canadian Cardiovascular Society has AMI Best Practice Guidelines CCS – Canadian Cardiovascular Society has AMI Best Practice Guidelines IHI & SHN has built momentum and awareness of 6 strategies IHI & SHN has built momentum and awareness of 6 strategies

91
Spread Check List – Leadership We have an overall spread plan Our spread activities are included in strategic and business plans of our organization We have visible and active support from our senior leader to spread our changes Roles and responsibilities for spread are clearly defined Senior leader assures success, remove barriers, make case for change Day to day leaders communicate, develop messengers, educate, make it easy for others to do the work

92
Additional Considerations Developing the Communication Plan Developing the Communication Plan Strengthening the Social System Strengthening the Social System Developing the Measurement and Feedback System Developing the Measurement and Feedback System

93
Measurement and Feedback Data collected on: Data collected on: –Outcome measures –Measures to track spread of specific changes Reporting to provide feedback Reporting to provide feedback –Link to follow up guidance and action Data and reporting at different levels within the organization Data and reporting at different levels within the organization –Both leadership and front line

94
Outcome Measure

95
Tracking the Spread of the Changes

96
Average Waiting Time for Next Available Appointment (Days) Outcome Measure - VHA
 Outcome Measure - VHA")
97
Overall Outcome Measure Measures using Small Multiples: Overall System and 4 sites The graphs for each site are called small multiples. They are designed for a quick visual comparisons of the data from each Site. The graphs are all presented on the same waiting time scale (0 to 100 days) and time scale (4/00 - 12/01).
 and time scale (4/ /01)..")
98
Spread Check List – Infrastructure Measures about our changes and spread plans are reviewed by our team and our sponsor More balancing, upstream and downstream Less frequent We have a method/process for knowledge transfer (including improvement science), continual learning and sharing information
, continual learning and sharing information")
99
Activity Take 10 minutes to review the Spread Checklist Take 10 minutes to review the Spread Checklist Check off the items your team has accomplished Check off the items your team has accomplished What area/s still needs work? What area/s still needs work?

100
Put it all together into a Plan

101
Developing a Plan for Spread Develop a Spread AIM Develop a Spread AIM Leadership Leadership Set-up/ infrastructure Set-up/ infrastructure Communication Communication Social System Social System Measurement and Feedback Measurement and Feedback

102
Spread What: Spread What: Target Level of Performance: Target Level of Performance: Spread to Whom: Spread to Whom: Time frame: Time frame: Developing a Spread Aim

103
Developing an Initial Spread Plan Consider how the organization structure can be used to facilitate spread: Consider how the organization structure can be used to facilitate spread: –How are adoption decisions made? –What infrastructure enhancements will assist in achieving the Aim? –How will the spread efforts be transitioned to operational responsibilities?

104
Spread What: Ventilator Bundle Spread What: Ventilator Bundle Target Level of Performance: Zero Cases of VAP Target Level of Performance: Zero Cases of VAP Spread to Whom: All ICUs in our 10 hospital system Spread to Whom: All ICUs in our 10 hospital system Time Frame: By September 2007 Time Frame: By September 2007 Sample Spread Aim: Prevent Ventilator Associated Pneumonia by Implementing the Vent Bundle

105
Spread What: BPMH & Documentation form Spread What: BPMH & Documentation form Target Level of Performance: Zero unintentional discrepancies Target Level of Performance: Zero unintentional discrepancies Spread to Whom: All units in our 10 hospital system Spread to Whom: All units in our 10 hospital system Time Frame: By September 2007 Time Frame: By September 2007 Sample Spread Aim: Prevent Adverse Drug Events by Implementing BPMH and Documentation form

106
Levels of Spread Activities – Level 1 Set-up/Infrastructure Set-up/Infrastructure –Establishing steering committees –Orienting leadership groups –Organizing data collection –Developing materials –Identifying successful sites General Communication General Communication –Wide spread dissemination of information about the initiative –Sending out comparative data –Holding meetings with a broad range of potential adopters

107
Level 2 Spread Activities Identification of Early Adopters Identification of Early Adopters –The push of general communication from Level 1 results in pulling adopters to the project –The number and different categories of adopters identified are good measures for LEVEL 1 activities –The key activity here is identification of the early adopters and a plan for how they will be integrated into the work

108
Level 3 Spread Activities Strategies to Get Adopters to Action Strategies to Get Adopters to Action –Organizing purposeful peer-to-peer interaction that integrate adopters identified in your LEVEL 2 activities (e.g. mentoring, visiting, meetings with specific invitation lists, and group discussions around materials on the website) –Champions for successful sites identified in Level 1 can help to provide the technical support needed although each early adopter should be able to add to the knowledge exchange –Champions for successful sites identified in Level 1 can help to provide the technical support needed although each early adopter should be able to add to the knowledge exchange
 –Champions for successful sites identified in Level 1 can help to provide the technical support needed although each early adopter should be able to add to the knowledge exchange –Champions for successful sites identified in Level 1 can help to provide the technical support needed although each early adopter should be able to add to the knowledge exchange.")
109
Communication Plan Building AwarenessBuilding Awareness Moving adopters from decision to actionMoving adopters from decision to action Supporting and mentoring adoptersSupporting and mentoring adopters

110
Level 4 Spread Activities Feedback loops for LEVEL 3 activities Feedback loops for LEVEL 3 activities –Collecting and reviewing data on the adoption of the key changes and the outcome measures –The aim is to understand how LEVEL 3 activities might be refined to improve upon results and how this might be best communicated with adopters Feedback and adjustments may be needed for: Feedback and adjustments may be needed for: –Communication plans –Materials and information –Support and mentorship –Infrastructure issues –Social system issues

112
Spreading the Story Describes steps to developing a communication plan Describes steps to developing a communication plan How to for “telling the story” How to for “telling the story” Quick read Quick read Sarah Fraser - Health Management June 2000; 10-12

113
Some Theory on Spread Everett Rogers: Adopter categories; Attributes of an innovation; Different aspects of communication Everett Rogers: Adopter categories; Attributes of an innovation; Different aspects of communication John Seely Brown: Content, context, community John Seely Brown: Content, context, community Malcolm Gladwell : Tipping point; Stickiness factor; Law of the few; Power of context Malcolm Gladwell : Tipping point; Stickiness factor; Law of the few; Power of context Nancy Dixon: Explicit and tacit knowledge Nancy Dixon: Explicit and tacit knowledge James Prochaska: Stages of Change Model James Prochaska: Stages of Change Model Albert Bandura : Preconditions for change; Motivation; Modeling and guided enactment Albert Bandura : Preconditions for change; Motivation; Modeling and guided enactment

114
Acknowledgements Strategies for Spreading Improvements in Health Care, October 14, 2004 Marie W. Schall, Institute for Healthcare Improvement Strategies for Spreading Improvements in Health Care, October 14, 2004 Marie W. Schall, Institute for Healthcare Improvement Holding the Gains and Spread, July 11, 2006 Holding the Gains and Spread, July 11, 2006 Bruce Harries, Improvement Associates The Seven ‘Spreadly’ Sins, October 18, 2006 The Seven ‘Spreadly’ Sins, October 18, 2006 Roger Resar, MD & Carol Haraden, PhD Sustainability and Spread, August 28, 2006 Sustainability and Spread, August 28, 2006 Diane Jacobsen, MPH, CPHQ, IHI National Director

115
References References Attewell, P. Technology Diffusion and Organizational Learning, Organizational Science, February, 1992 Bandura A. Social Foundations of Thought and Action. Englewood Cliffs, N.J.: Prentice Hall, Inc. 1986. Brown J., Duguid P. The Social Life of Information. Boston: Harvard Business School Press, 2000. Cool et al. Diffusion of Information Within Organizations: Electronic Switching in the Bell System, 1971 –1982, Organization Science, Vol.8, No. 5, September - October 1997. Dixon, N. Common Knowledge. Boston: Harvard Business School Press, 2000. Fraser S. Spreading good practice; how to prepare the ground, Health Management, June 2000. Gladwell, M. The Tipping Point. Boston: Little, Brown and Company, 2000. Kreitner, R. and Kinicki, A. Organizational Behavior (2 nd ed.) Homewood, Il:Irwin,1978.
 Homewood, Il:Irwin,")
116
References References Langley J, Nolan K, Nolan T, Norman, C, Provost L. The Improvement Guide. San Francisco: Jossey-Bass 1996. Lomas J, Enkin M, Anderson G. Opinion Leaders vs Audit and Feedback to Implement Practice Guidelines. JAMA, Vol. 265(17); May 1, 1991, pg. 2202- 2207. Myers, D.G. Social Psychology (3 rd ed.) New York: McGraw-Hill, 1990. Prochaska J., Norcross J., Diclemente C. In Search of How People Change, American Psychologist, September, 1992. Rogers E. Diffusion of Innovations. New York: The Free Press, 1995. Wenger E. Communities of Practice. Cambridge, UK: Cambridge University Press, 1998.
; May 1, 1991, pg Myers, D.G. Social Psychology (3 rd ed.) New York: McGraw-Hill, Prochaska J., Norcross J., Diclemente C. In Search of How People Change, American Psychologist, September, Rogers E. Diffusion of Innovations. New York: The Free Press, Wenger E. Communities of Practice. Cambridge, UK: Cambridge University Press,")
Similar presentations


 Name(s) of presenter(s) Organizational Affiliation Welcome WI Mental Health Collaborative V February 24, 2014.>")


