Download presentation
Presentation is loading. Please wait.

1
Modeling Approach to Assess Odor Levels from Industrial Facilities A&WMA Southern Section Conference 2015, Callaway Gardens, GA Milena Borissova

2
Odor – Basic Facts Odor – Regulations Odor – Modeling AERMOD modeling system Sample Case Study Discussions and Conclusions Agenda

3
An odor is caused by one or more volatilized chemical compounds that humans or other animals perceive by the sense of olfaction The odorant molecules trigger reaction from the olfactory neurons neurons mediate signals to the olfactory bulb bulb sends electric signals to the brain to form specific smell perception There are different types of olfactory neurons responding to different odorants Odor - Basic Facts

4
Odor sensation usually depends on the odorant concentration. A single odorant is typically recognized by multiple neurons, and different odorants may be recognized by combinations of neurons. The combined signals create specific patterns, identified by the brain as odors. The olfactory system does not interpret a single compound, but instead the whole odorous mix Odor sensation not necessarily corresponds to concentration or intensity of any single constituent. Odors could be harmful: causing headaches, nausea, and all stress symptoms Odor - Basic Facts (cont.)
.")
5
Most odors consist of organic compounds – acetone, benzene; others do not containing carbon atoms – hydrogen sulfide (H 2 S), ammonia (NH 3 ) Habituation effect – after continuous odor exposure, the sense of smell dissipates quickly, but recovers rapidly after the stimulus is removed. Brain tends to ignore continuous stimulus and focus on differences and changes in a particular sensation. An objective and analytical measure of odor is impossible. Odor sensation and perception are very individual and are related to gender, age, state of health, and personal history. Odor - Basic Facts (cont.)
.")
6
Odor emission complex mixture of many odorous compounds. => Analytical monitoring of individual chemical compounds is not practical. => For measuring odors, sensory methods, instead of instrumental, are normally used. Today odor sensory methods are available for both monitoring emissions from sources establishing odor quantities in ambient air. For monitoring purposes odor has 5 properties related to threshold and tolerance: Concentration, Intensity, Quality, Hedonic Tone, and Character Measuring Odor

7
Odor concentration is the odor's characteristics of pervasiveness. To measure odor sensation, an odor is diluted to certain amounts such that it reaches a detection or recognition threshold. The detection threshold is the concentration of an odor in air when 50% of a population can distinguish between the odorous sample and an odor free blank. The recognition threshold is the concentration of an odor in air in which 50% of a population can discern the type of odor from an odorous sample and odor free blank. The recognition odor threshold is usually a factor of 2 to 5 times higher than the detection threshold. The measurement of odor concentration is the most widespread method to quantify odors. The method is based on dilution of an odor sample to the detection threshold. The numerical value of the odor concentration is equal to the dilution factor that is necessary to reach the detection threshold – Dilution- to-Threshold method (D/T). Odor concentration is expressed odor units (OU); odor threshold concentration is 1 OUE by definition. n-Butanol is used as calibration gas for odor concentration measurements: 1 OU/m 3 ≡ 40 ppb/v n-butanol Odor Properties – Concentration
. Odor concentration is expressed odor units (OU); odor threshold concentration is 1 OUE by definition. n-Butanol is used as calibration gas for odor concentration measurements: 1 OU/m 3 ≡ 40 ppb/v n-butanol Odor Properties – Concentration.")
8
Butanol Scale D/T (OU)Word Category 2Noticeable 7Objectionable 15Nuisance 31Nauseating
Word Category 2Noticeable 7Objectionable 15Nuisance 31Nauseating")
9
Odor intensity is the perceived strength of odor sensation. This intensity property is used to locate the source of odors and perhaps most directly related to odor nuisance. Perceived strength of the odor sensation is measured in conjunction with odor concentration. This can be modeled by the Weber-Fechner law: I = a × log(c) + b I - the perceived intensity, a - the Weber-Fechner coefficient, odorant specific c - the chemical concentrations, b - the intercept constant Odor intensity can be divided into the following categories according to intensity: 0 – no odor; 1 – very weak (odor threshold); 2 – weak; 3 – distinct; 4 – strong; 5 – very strong; 6 – intolerable Odor Properties – Intensity
 + b I - the perceived intensity, a - the Weber-Fechner coefficient, odorant specific c - the chemical concentrations, b - the intercept constant Odor intensity can be divided into the following categories according to intensity: 0 – no odor; 1 – very weak (odor threshold); 2 – weak; 3 – distinct; 4 – strong; 5 – very strong; 6 – intolerable Odor Properties – Intensity.")
10
Currently world-wide there is no regulatory system to enforce odor controls. Odor guidelines in the form of either a nuisance law (common in certain states in the USA) as National Air Quality Standards (Australia, New Zealand, Europe, Canada). The laws range wildly between states and between countries, partly because of the "gray line" that exists between whether odors are a nuisance or whether the odor has negative health effect. 44 of the 50 states have regulations that deal directly or indirectly with odors from concentrated animal feeding operations Odor Regulations
 as National Air Quality Standards (Australia, New Zealand, Europe, Canada). The laws range wildly between states and between countries, partly because of the gray line that exists between whether odors are a nuisance or whether the odor has negative health effect. 44 of the 50 states have regulations that deal directly or indirectly with odors from concentrated animal feeding operations Odor Regulations.")
11
Measuring nomenclature is adopted in modeling – express odorant quantities in OU using specific scales The mechanisms of odorant dispersion in the atmosphere are the same as the dispersion of other pollutants – criteria, TAPs, VOCs, therefore the commonly known dispersion models are utilized; no odor specific models have been developed For modeling purposes a specific chemical is identified as dominant and selected as a surrogate of the odorant. We could model more than one chemical compound, but have no means to combine their composite impact as single odorant impact Odor and Dispersion Modeling

12
This study deals with ambient air odorants dispersion (not indoor) The selected model is the latest version of the EPA’s regulatory system – the AERMOD 15181 suite Odor impact depend on: Odorant emission rates Source type Averaging time / model time resolution Meteorological conditions Terrain and land use features Modeling options Odor and Dispersion Modeling
 The selected model is the latest version of the EPA’s regulatory system – the AERMOD suite Odor impact depend on: Odorant emission rates Source type Averaging time / model time resolution Meteorological conditions Terrain and land use features Modeling options Odor and Dispersion Modeling")
13
AERMOD modeling system is a steady-state Gaussian dispersion model comprised of several modules: Meteorological module – AERMET Terrain module – AERMAP Dispersion module – AERMOD Additional pre/post-processors: AERMINUTE, AERSURFACE, AERPLOT, LEADPOST More about each module will be discussed in terms of the case study that follows AERMOD Modeling System

14
H 2 S AERMOD MODELING Test Case for Fictional Industrial Facility at Callaway Gardens

15
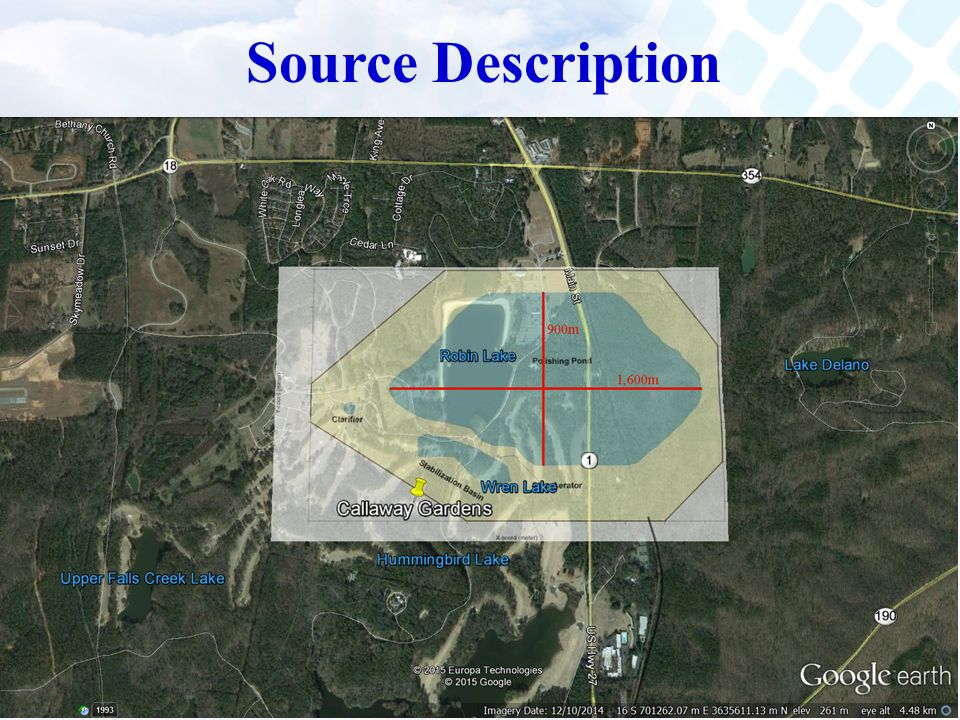
Industrial area source complex from a typical Pulp and Paper facility assumed to be located at Callaway Gardens – Callaway site Sources of fugitive type: Polishing Pond, Stabilization Basin, Step Aerator, and Clarifier Emission rates: H 2 S concentrations at the sources were collected in 3 consecutive monitoring campaigns, lasting about an hour Continuous hourly H 2 S emission rates derived to initialize the model and used as a surrogate of the odorant emissions Source Description

17
Meteorological data for 2014: Surface data – hourly and ASOS 1-minute winds: Columbus Metropolitan airport, Columbus, GA; station is approximately 22.5 miles to the south of project site Upper Air data: Falcon Field station, Atlanta, GA Surface micrometeorological parameters derived from land characteristics of the Callaway site, allowing for seasonal variations and assuming 2014 is a year of average precipitation ADJ_U* option used – non-default model option, intended to improve AERMOD performance in light wind, stable atmospheric conditions Meteorology

18
H 2 S AERMOD MODELING

19
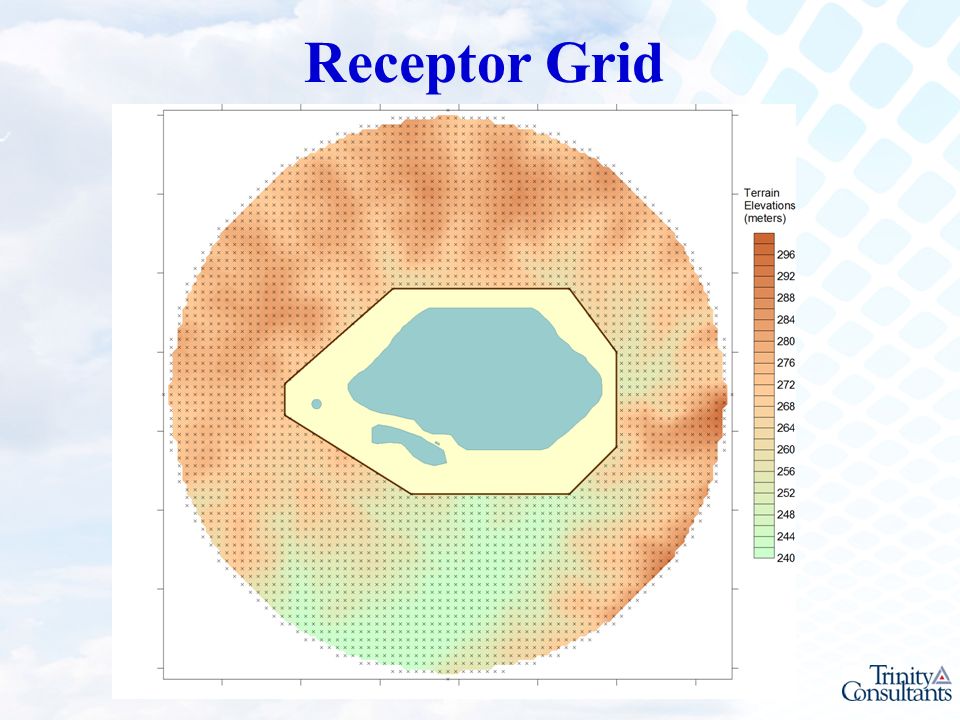
50 meter (164 ft) spaced receptor points were placed within 1km-wide belt around the facility boundary The largest impacts from ground level sources are anticipated close to the sources Terrain elevations and hill heights were extracted with AERMAP Minimum source-to-receptor distance varies within 90 – 200 meters Receptor Grid
 spaced receptor points were placed within 1km-wide belt around the facility boundary The largest impacts from ground level sources are anticipated close to the sources Terrain elevations and hill heights were extracted with AERMAP Minimum source-to-receptor distance varies within 90 – 200 meters Receptor Grid")
21
AERMOD v.15181 ran in Non-default LOWWIND3 mode, with rural dispersion coefficients No parametrization for chemical transformations Constant hourly emission rates assuming year-round continuous operations; no seasonal variations to account for different evaporation rates, operational loads… Sources represented as ground level release with no initial dispersion; emission rates are independent of wind speed Odor impacts are expressed in terms of H 2 S concentrations in OU, calculated on the butanol scale AERMOD Dispersion

22
Maximum Predicted Impacts Averaging Period Concentration (OU) Odor Character Number of Noticeable level Exceedances 1-Hour20.33Nuisance830 8-Hour6.89Noticeable137 24-Hour3.49Noticeable25 Annual0.69Undetectable0 Maximum impacts occur during the cold season, on the hours of light winds and stable atmospheric conditions – clear, cold, and calm January mornings just before sunrise
 Odor Character Number of Noticeable level Exceedances 1-Hour20.33Nuisance830 8-Hour6.89Noticeable Hour3.49Noticeable25 Annual0.69Undetectable0 Maximum impacts occur during the cold season, on the hours of light winds and stable atmospheric conditions – clear, cold, and calm January mornings just before sunrise")
23
Maximum 1-hour Concentrations Concentration (OU) No. of Receptors 2653 765 154 310 Maximum impact occurs on Jan 26, hour 8; WS = 0.57 m/s (1.3 mph) just before the morning inversion broke
 just before the morning inversion broke.")
24
Maximum 1-hour Exceedances

25
Change of Concentrations

26
The peak impacts are predicted to the west of the facility boundary and can be classified to reach level nuisance with probability less than 10% Highest impacts are localized close to the sources – at the facility boundary Odor events at nuisance level are equally possible throughout the entire year; reaching levels of nauseating is unlikely Summary of Results

27
Discussions and Conclusions

28
Benefits of modeling: Modeling is less expensive and faster than monitoring and allows for variations Modeling provides continuous analysis for long periods and different atmospheric conditions Monitoring of fugitive sources emissions – very difficult, at this time rarely performed Discussions

29
Areas of possible Improvement: Sub-hourly emissions and meteorology would characterize the odor events better Variable emission rates and variable source parameters (area) would provide more realistic representation. Better speciation; only H 2 S was analyzed. New odor specific model would be best Local site-specific odor calibration study would be huge improvement Local meteorological data are essential for accurate assessment Guidelines and regulations Conclusions

30
Questions?

Similar presentations


 Kenneth G. Wastrack Doyle E. Pittman Jennifer M. Call Tennessee Valley Authority.>")


 Wind Observations Vectors have both magnitude and direction. Wind is a vector quantity. The components of wind.>")


 5:00-7:00 PM I’ll answer questions on my material, then Chad will answer questions on.>")

