Download presentation
Presentation is loading. Please wait.

1
17_00CO.JPG Ch. 17 Atmosphere and Air Pollution

2
Rules/Regulations http://streaming.factsonfile.com/PortalPlaylists.as px?aid=17963&xtid=35562&loid=31344

3
New York City – Congestion pricing??

4
The atmosphere’s composition Composition

5
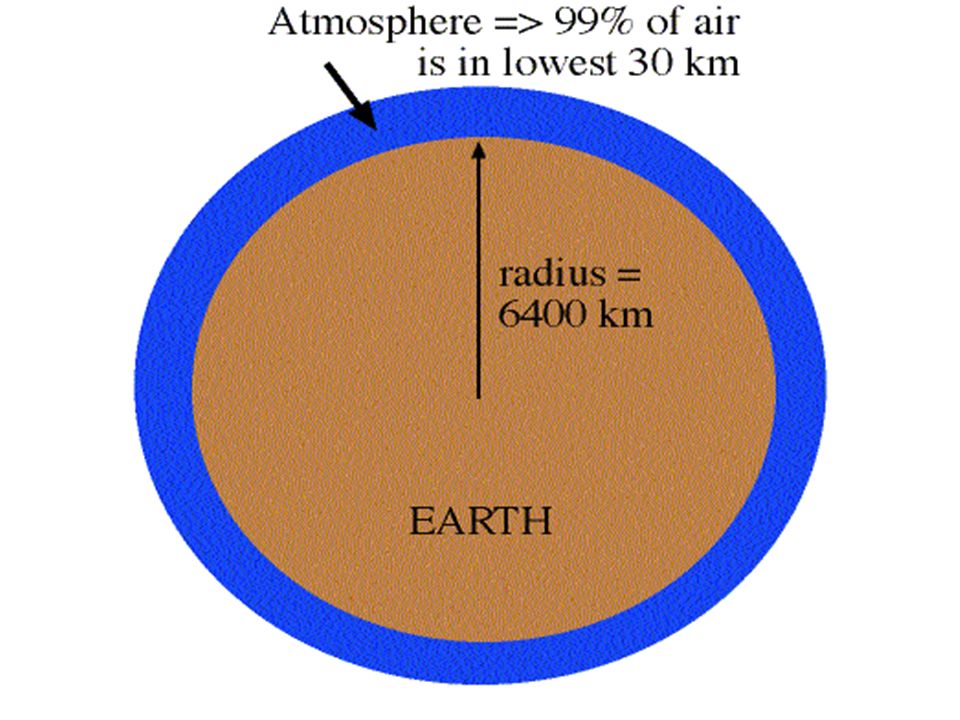
17_02.JPG Thermosphere Up to 500km (300 mi) High temp – would feel cold Mesosphere 50-80km (31-56mi) Low pressure, temp. drops Stratosphere 11-50 km (7-31 mi) Drier/less dense Temp. increases with altitude due to O3 (17-30kim or 10-19 mi) Troposphere Avg. thickness 11km (7 mi) Weather Temperature/density decline with altitude
 Drier/less dense Temp. increases with altitude due to O3 (17-30kim or mi) Troposphere Avg. thickness 11km (7 mi) Weather Temperature/density decline with altitude.")
7
17_03.JPG Atmospheric Pressure= force per unit area produced by a column of air Sea Level = 1013 mb (14.7 lb/in 2 ) 29035 ft (Everest top) = 300mb
 ft (Everest top) = 300mb")
9
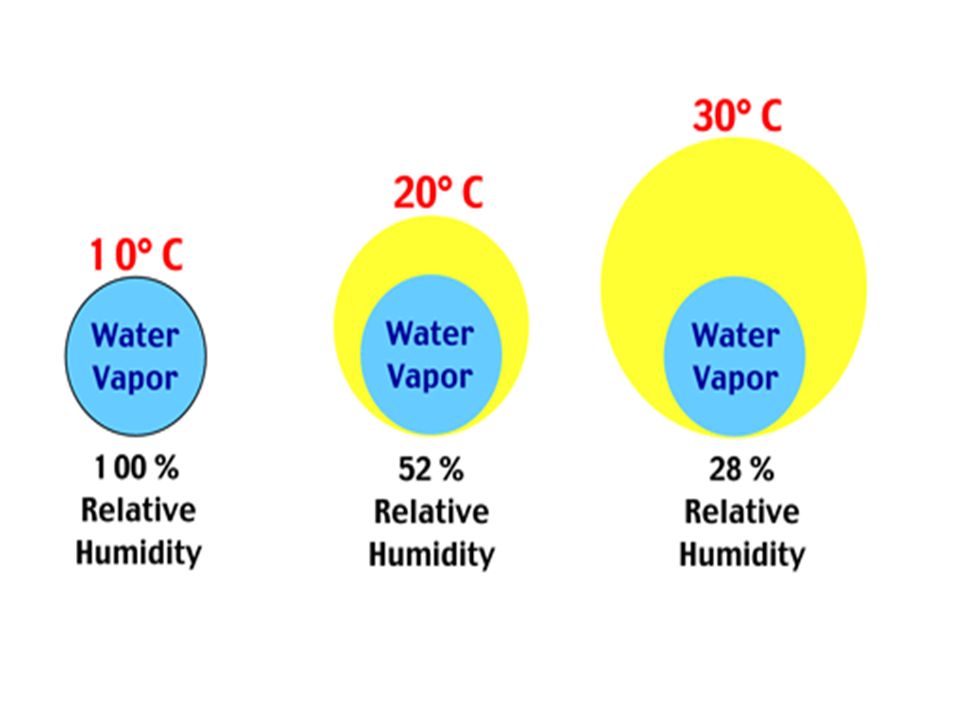
Atmospheric properties Relative humidity = the ratio of water vapor a given volume of air contains to the amount it could contain at a given temperature. Expressed as percent

10
Temperature = average kinetic energy in molecules Thermometer = molecular speedometer

11
17_04.JPG

12
Equator – Angle of incident radiation perpendicular, greatest concentration of energy Poles – Angle of incident radiation obtuse, less concentrated ***The troposphere is warmed primarily by convection

13
17_05.JPG Seasons

14
Weather: local physical properties of the troposphere over short time periods: temp, pressure, cloud cover, wind, humidity Climate: patter of atmospheric conditions found across large geographic regions over long periods of time

16
17_06.JPG Convective Circulation

17
17_07.JPG

18
17_07a.jpg

19
17_07b.jpg

20
Air Pollutants removed by: –Precipitation –mixing

21
17_08a.jpg Mixing removes pollutants

22
17_08b.jpg Pollutants trapped

23
17_09.JPG Large scale convective cells determine global patterns of humidity and aridity

24
17_09ab.jpg

25
17_09at.jpg

26
17_09b.jpg Coriolis Effect – apparent deflection of air from straight path as globe moves beneath

27
17_10a.jpg Outdoor Air Pollution (Ambient) Natural Sources: Dust Storms Carry fungal and bacterial spores
 Natural Sources: Dust Storms Carry fungal and bacterial spores")
28
17_10b.jpg Volcanoes: Particulates including ash, aerosols of SO 2 can cool atmosphere

29
17_10c.JPG Fires: Particulates and gases

30
Types of outdoor air pollution Point Sources = specific spots where large quantities of pollutants are discharged (power plants and factories) Nonpoint Sources = more diffuse, consisting of many small sources (automobiles) Primary Pollutants = directly harmful,and can react to form other harmful substances Secondary Pollutants = form when primary pollutants interact with components of the atmosphere Anthropogenic Sources
 Nonpoint Sources = more diffuse, consisting of many small sources (automobiles) Primary Pollutants = directly harmful,and can react to form other harmful substances Secondary Pollutants = form when primary pollutants interact with components of the atmosphere Anthropogenic Sources")
31
Primary Pollutants Stationary Mobile Sources Natural Most hydrocarbons Most suspended particles SO 2 NO NO 2 CO CO 2 Secondary Pollutants SO 3 HNO 3 H 2 SO 4 H2O2H2O2H2O2H2O2 O3O3O3O3 PANs Most NO 3 – SO 4 2– salts

32
Successful legislation Clean Air Act of 1970 –standards for air quality –limits on emissions –funds for pollution-control research –Allows citizens to sue parties violating the standards The Clean Air Act of 1990 –Strengthens standards for auto emissions, toxic air pollutants, acidic deposition, stratospheric ozone depletion –Introduced emissions trading for SO 2

33
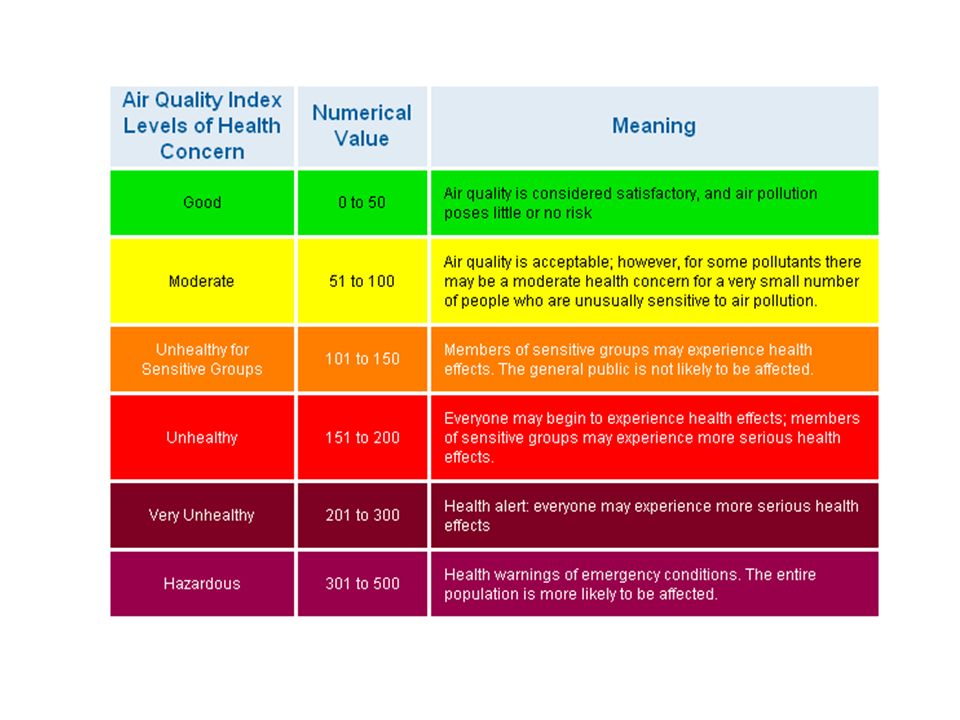
6 Criteria Pollutants

34
17_11.JPG

37
What is the good news????

38
Air pollution has decreased since 1970

39
17_14.JPG Remove up to 90% particulates and SO 2

40
Reasons for the decline in U.S. pollution Cleaner-burning vehicles and catalytic converters decrease carbon monoxide Permit-trading programs and clean coal technologies reduce SO 2 emissions Scrubbers = technologies that chemically convert or physically remove pollutants before they leave the smokestacks Phaseout of leaded gasoline Improved technologies and federal policies

41
17.16 Industrial smogPhotochemical smog

42
17_16a.jpg Photochemical Smog

43
Photochemical (brown air) smog Produced by a series of reactions –Hot, sunny cities surrounded by mountains –Light-driven reactions of primary pollutants and normal atmospheric compounds –Morning traffic exhaust releases pollutants –Irritant – eyes, throat, nose –decreased due to emissions testing Photochemical Smog
 smog Produced by a series of reactions –Hot, sunny cities surrounded by mountains –Light-driven reactions of primary pollutants and normal atmospheric compounds –Morning traffic exhaust releases pollutants –Irritant – eyes, throat, nose –decreased due to emissions testing Photochemical Smog")
44
1. 2NO+ O 2 2NO 2 2. NO 2 + UV NO + O 3. O 2 + O O 3 Typical Daily Patterns Air Quality Guide for Ozone

45
17_15b.JPG function addLoadEvent(func){var oldonload = window.onload;if (typeof window.onload != 'function') {window.onload = func} else {window.onload = function() {if (oldonload) {oldonload()}func()}}} addLoadEvent(function S31343(){document.getElementById('emb31343').innerHTML=" ";});
{var oldonload = window.onload;if (typeof window.onload != function ) {window.onload = func} else {window.onload = function() {if (oldonload) {oldonload()}func()}}} addLoadEvent(function S31343(){document.getElementById( emb31343 ).innerHTML= ;});")
46
17_16b.JPG

47
17_SBS01-02.JPG Stratospheric Ozone

48
The hole in the ozone Ozone hole = ozone levels over Antarctica had declined by 40-60% –Depletion also in the Arctic and globally –Causes skin cancer, harms crops and decreases ocean productivity

49
The Montreal Protocol addressed ozone depletion Montreal Protocol = 180 nations agreed to cut CFC production in half –Follow-up agreements deepened cuts –ozone-depleting chemicals has decreased 95% –The ozone layer is beginning to recover –Success story included industry adaptive management strategy –Model for international cooperation

50
Sources of acid deposition Originates from burning fossil fuels that release sulfur dioxide and nitrogen oxides –These compounds react with water to form sulfuric and nitric acids Acid Deposition

51
17_19a.jpg

52
17_19b.JPG

53
Acid deposition has not been greatly reduced Scrubbers have helped SO 2 emissions are lower (cap and trade) But, NO x emissions are higher Acid Deposition not Greatly Reduced
 But, NO x emissions are higher Acid Deposition not Greatly Reduced")
54
17_20.JPG

55
17_T01.JPG

56
17_23.JPG Indoor Air Quality

57
17_22.JPG

58
17_21.JPG

Similar presentations


 burn, they release water vapor and carbon dioxide.>")


>")


 78% Nitrogen.>")


