Download presentation
Presentation is loading. Please wait.

1
Foliage and Branch Biomass Prediction an allometric approach

2
Problem The prediction of crown biomass (foliage and branches) is more difficult to make because of sophisticated structures, and irregular distributions (not continuous and less uniform)
 is more difficult to make because of sophisticated structures, and irregular distributions (not continuous and less uniform)")
3
Virtual Density Assume that crown biomass distributes uniformly on crown cross-area and continuously along crown depth and thus continuous functions can be applied for describing density variation.

4
Virtual Foliage Density Distribution l H hh h 0 Where r=density H=total tree height, l=crown length, h=the distance from tree top, and h=distance increment. r

5
the value of the density should be zero at the top of tree the density increases along crown depth until it reaches a maximum and then decreases

6
Candidates Weibull Maxima flexibility symbolic solution applied before Yes N/A Yes N/A

7
Distribution Function Selected Maxima Function Where and are the coefficients

8
Distribution & Foliage Biomass Assume that Where F B is foliage biomass.

9
Foliage Biomass Function (Integration) Where k is the transition coefficient.
 Where k is the transition coefficient.")
10
Foliage Biomass Equation = an adjustment term of crown length = the assimilation rate according to the Lambert-Beer’s law

11
Foliage Biomass & Sapwood area According to the pipe model theory, foliage biomass is proportional to the sapwood area at breast height: Where S A = sapwood area is the proportionality coefficient

12
Foliage Biomass & Age Foliage biomass was affected by age and a proposed function relationship is: Where A is tree age is a coefficient

13
Constant Transition Method Let k (in foliage biomass equation) be equal to:
 be equal to:")
14
Foliage Biomass Equation (revised) or: Where is a coefficient
 or: Where is a coefficient")
15
Branch Biomass Equation A linear relationship exists between foliage biomass and branch biomass, that is: Where B B is branch biomass is a coefficient

16
Fertilization Impact Fertilization significantly increased foliage biomass. The distribution of leaf biomass could be shifted higher for fertilized trees. Therefore, the distribution coefficient should be adjusted for fertilized trees.

17
Region Impact Physiographic region is also a factor that affects foliage and branch biomass. Thus, parameters and in both biomass prediction models should differ by region.

18
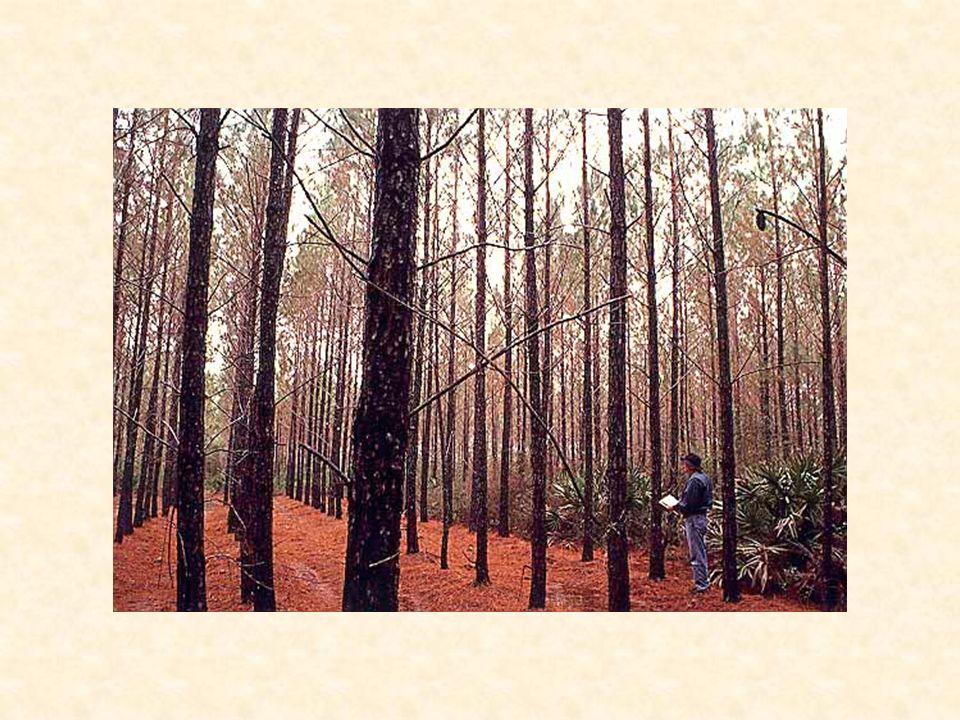
Data Data came from the Consortium for Accelerated Pine Plantation Studies (CAPPS), which was initiated in 1987 and maintained by the School of Forest Resources, University of Georgia.
, which was initiated in 1987 and maintained by the School of Forest Resources, University of Georgia.")
20
H - complete vegetation control F - annual fertilization HF - both H and F C - check plot Treatments

22
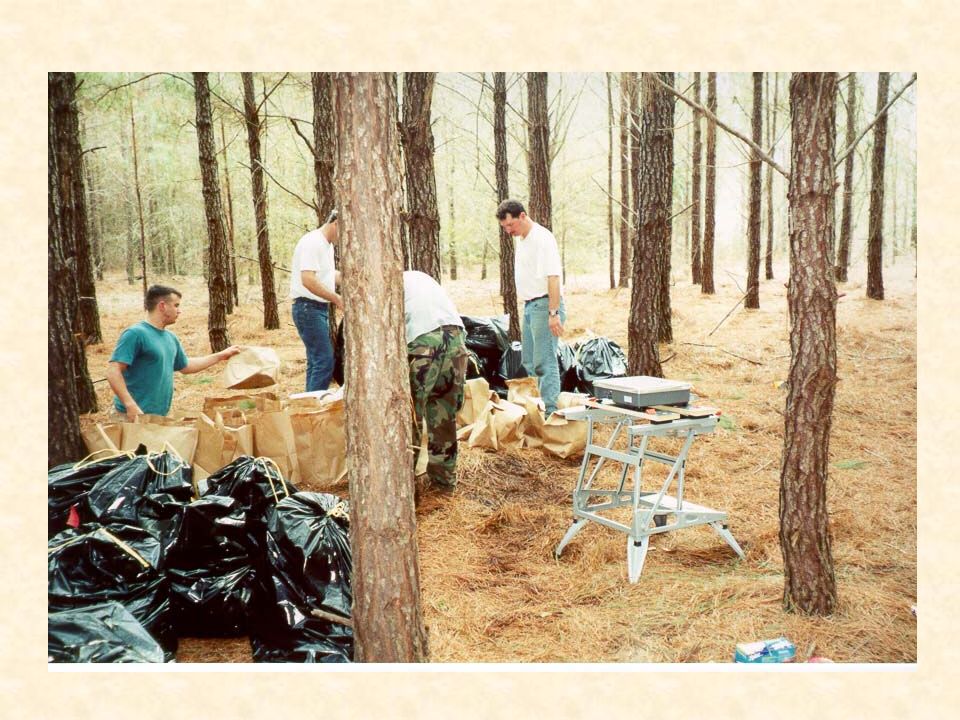
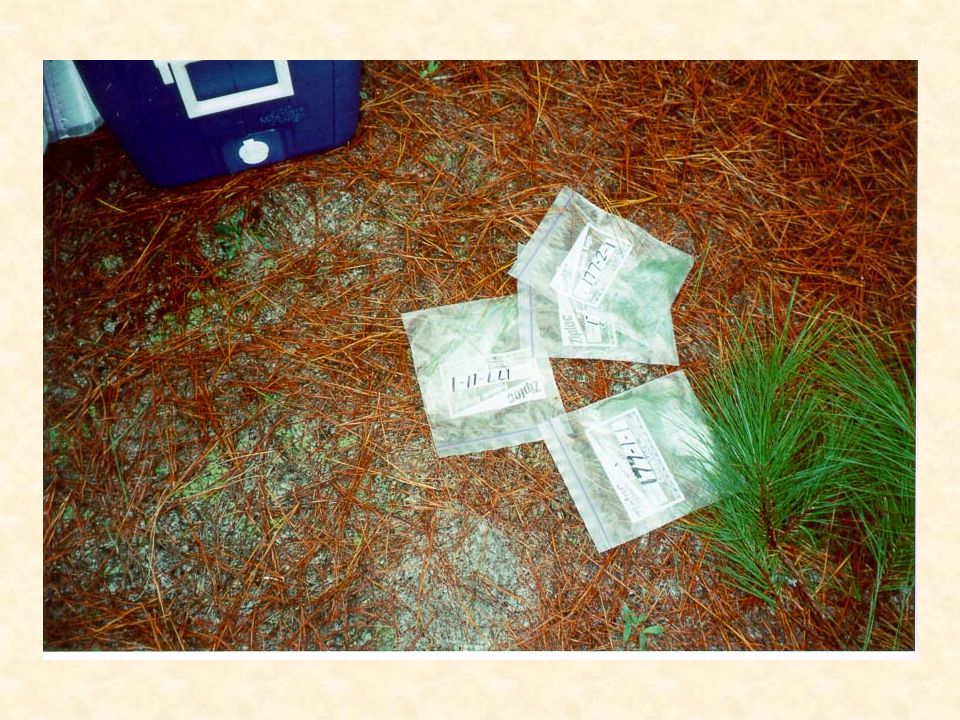
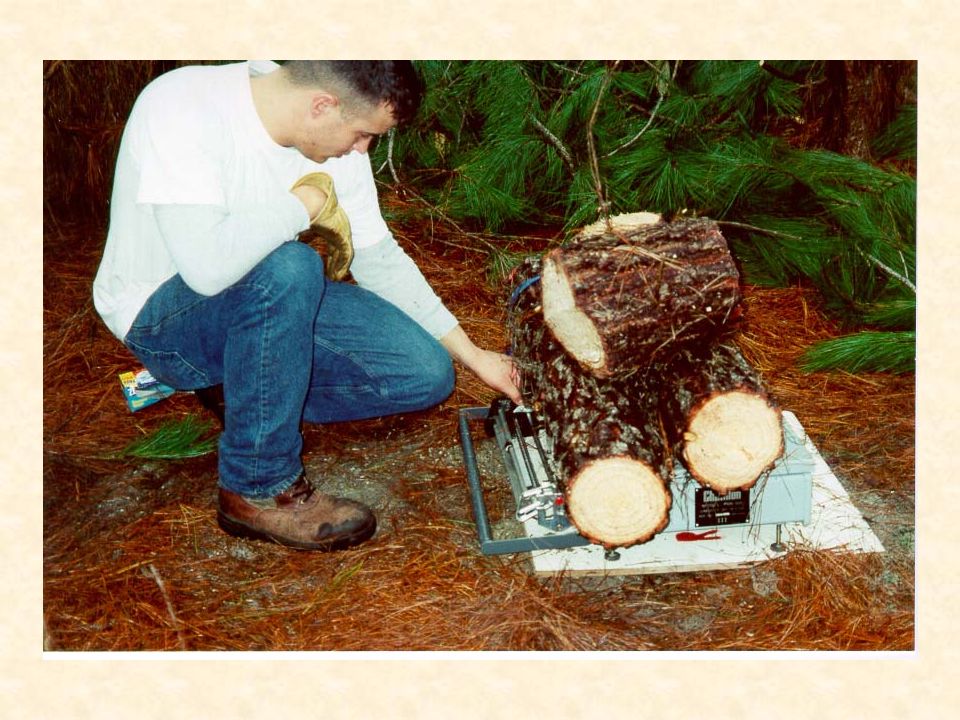
In the winter of 1999, 192 trees were harvested in the lower coastal plain of Georgia for research on foliage, branches, and stem biomass. In the winter of 2000, the same amount trees were harvested in the piedmont of Georgia for the same purpose. Foliage and Branch Samples

24
Data Analysis complete vegetation control did not significantly affect foliage biomass fertilization significantly increased foliage biomass. age is a significant predictor of foliage biomass foliage and branch biomass differ significantly by region

25
Model Fitting Nonlinear mixed-effects system modeling method was employed in order to obtain consistent and unbiased estimates. Calculated foliage biomass were applied for an independent variable in the branch biomass prediction model fitting to eliminate simultaneous equation bias.

26
Estimates (the Piedmont)
")
27
Estimates (the Lower Coastal Plain)
")
28
Fit Statistics

29
Predictions & Observations foliage biomass in the Piedmont

30
Predictions & Observations foliage biomass in the Lower Coastal Plain

31
Predictions & Observations branch biomass in the Piedmont

32
Predictions & Observations branch biomass in the Lower Coastal Plain

33
Growth Trend Foliage and branch biomass growth of fertilized trees keep from dropping until age 12 in both regions. Foliage and branch biomass growth of unfertilized trees drop from age 10 in the piedmont.

34
Dry Foliage Biomass same dbh (18 cm), the Piedmont
, the Piedmont")
35
Dry Foliage Biomass same dbh (18 cm), the Lower Coastal Plain
, the Lower Coastal Plain")
36
Fertilized vs Unfertilized Dry foliage biomass of a unfertilized tree is more than the fertilized tree with the same dbh. A plausible explanation- a tree in unfertilized stands may be more dominant than the fertilized tree with the same dbh.

37
Position of the Maximum Density Let the first order derivation of the virtual density r be zero, i.e.,

38
Position of the Maximum Density That is, Where r reaches the maximum value.

39
Position of the Maximum Density For unfertilized trees For fertilized trees

40
Position of the Maximum Density The average crown length is 6.98 meters for unfertilized trees and 7.47 meters for fertilized trees. The position is at about upper 78% (100(1-1.57/6.98)) tree crown for unfertilized trees and upper 81% (100(1- 1.45/7.47)) tree crown for fertilized trees.
) tree crown for unfertilized trees and upper 81% (100( /7.47)) tree crown for fertilized trees..")
41
Age & Foliage Biomass If a tree reaches larger size at younger age, it should gain more foliage biomass. The foliage biomass of a fertilized tree with dbh 18 cm and crown length 8 m at age 10 is about 5 kg, versus a unfertilized tree with the same dbh and crown length at age 12, 4.75 kg. That is, the younger fertilized trees gained more than 5% foliage biomass.

42
Number of Parameters The allometric approach significantly reduced the number of parameters to be estimated. The developed foliage and branch biomass prediction models used only four parameters, compared with the empirical models, where eight parameters were used for the same purpose.

Similar presentations


 2004 Brooks/Cole, a division of Thomson Learning, Inc. Chapter 13 Nonlinear and Multiple Regression.>")
>")


