Download presentation
Presentation is loading. Please wait.

1
Keith Torgerson, NDSCS

2
Farms in the Annual Red River Valley Annual Report FINAN, the analysis software, allows us to take a closer look at the farms in a region or state. We can create summaries of: Farm Size (based on Gross Income) Type of Farm (based on 70% of gross income) Age of Operator Other special sorts based on location, production practices, enterprise selection and size, etc.
 Type of Farm (based on 70% of gross income) Age of Operator Other special sorts based on location, production practices, enterprise selection and size, etc..")
3
Farm Management Education Is Concerned With: 1. Creating an awareness of the need for accurate financial & enterprise records. 2. Stimulating individuals and families to establish goals and set priorities. 3. Developing the farm operator’s understanding of the function of management.

4
Farm Management Education Is Concerned With: 4. Developing fundamentals of resource management (Financial & Human). 5. Developing student skills in analyzing and interpreting farm business records. 6. Developing skills in analyzing data to improve the organization and efficiency of the farm business.
. 5. Developing student skills in analyzing and interpreting farm business records. 6. Developing skills in analyzing data to improve the organization and efficiency of the farm business..")
5
Ask Yourself these Questions. How do I compare? With my previous farm history? With local or county information? With area and statewide information? Is my farm getting the financial returns that I want or need? How do I go about making my farm business more efficient or profitable?

6
How Should I Use the Data Compare your financial and crop numbers to your peer group

7
Total Farm Assets Total farm assets increased $136,864 over last year. (Cost) 2006 $1,162,753 2007 $1,319,822 2008 $1,594,701 2009 $1,545,551 2010 $1,843,439 2011 $1,956,332 2012 $2,331,862 2013 $2,701,713 2014 $2,838,577
 2006 $1,162, $1,319, $1,594, $1,545, $1,843, $1,956, $2,331, $2,701, $2,838,577.")
8
Total Farm Liabilities Total farm liabilities increased $123,187 from last year And $301,310 over the last three years 2006 $543,610 2007 $576,908 2008 $681,055 2009 $683,852 2010 $735,208 2011 $755,356 2012 $838,328 2013 $1,016,451 2014 $1,139,636

9
Net Worth Change(Cost) This year we had a negative Net Worth change of $-72,160. 2008 $165,651 2009 $6,849 2010 $269,511 2011 $198,267 2012 $392,774 2013 -$45,911 2014 -$72,160

10
Farm Receipts Gross Farm receipts decreased by $107,871 due mainly to the decrease in farm prices since 2012. 2007 $729,735 2008 $897,727 2009 $843,024 2010 $931,278 2011 $1,104,412 2012 $1,163,839 2013 $1,122,746 2014 $1,014,875

11
Government Payments This includes direct, crp, and acre payments. 2006 $29,339 2007 $26,431 2008 $36,533 2009 $23,746 2010 $39,737 2011 $36,606 2012 $22,152 2013 $32,384 2014 $17,082

12
Farm Expenses Cash farm expenses increased by $17,082 2005 $454,623 2006 $508,716 2007 $602,429 2008 $718,042 2009 $651,196 2010 $701,797 2011 $789,890 2012 $850,730 2013 $806,992 2014 $817,498

13
How the $915,521 was spent including family living and income taxes. The three largest expense are seed, fertilizer and rent.

14
Net Farm Income This is the net cash farm income after being adjusted first for inventory change and than for depreciation This is the calculated profit for the year If more money than indicated on net farm income is spent on family living, personal taxes, and new investments, it must be taken from inventory sales, the capital replacement dollars, new borrowings, or from off farm income. It is also calculated under the cost balance sheet.

15
Net Farm Income For Valley Net farm income for farms in the Valley averaged $12,723 which was a decrease of $49,023 form last year and a decrease of $523,999 since 2012. Net farm income for the low 20% of the farms averaged a negative -$216,407 Net farm income for the high 20% of the farms averaged $232,417 Net farm income for the people in the 40%-60% averaged $10,220 The large decrease in Net Farm income was due to lower prices, and higher input costs

16
Net Farm Income (Profit) By Year (Before Living and Taxes)
 By Year (Before Living and Taxes)")
17
Crops and Feed Inventory Change This year we had a negative inventory change of -$104,417. Over the last two years, we have seen a negative drop in inventory of -$284,075.

18
$ Expense/$ Income In 2014 it cost a Valley farmer about 85.8 (accrual) to make a dollar’s worth of income. In 2013 it took 82.6 cents (accrual) and in 2012 it only took 55.4 cents (accrual). This number is the operating expense ratio and does not include interest or depreciation expense.
 and in 2012 it only took 55.4 cents (accrual). This number is the operating expense ratio and does not include interest or depreciation expense..")
19
Acres Farmed Stayed Steady

20
Farm Equipment and Building Purchases, A Good Useful Pickup is Tough to Beat.

21
Machinery and Buildings Purchased Machinery purchased for the year was $84,558 down $79,386 from last year and down $102,192 from 2012 Buildings purchased during the year averaged $15,446 per farm.

22
Non-Farm Income and Family Living Information

23
Apparent Family Living

24
Non Farm Income Average Non Farm Income was $23,242

25
Crop Yields, Costs and Returns

26
Net Return for Crops Does not include Acre Payments Does include Crop Insurance and RA and CRC insurance

27
Spring Wheat Yield Wheat yield increased about 3 bushels per acre from 2012

28
Spring Wheat Fertilizer Costs Per Acre

29
Spring Wheat Net Return/Acre The net return per acre of wheat on cash rented land was negative this year 2014 Average -$ 28.35 Low 20% -$140.55 High 20% $67.50

30
Spring Wheat Total List Costs

31
Soybeans Yield for 2014 was 37.5 bu per acre up about 3 bushels from 2013

32
Corn Yields & Net Return per Acre YieldNet Return 2007 131 bu $140.54 2008 155 bu $132.49 2009 132 bu -$47.95 2010 149 bu $196.89 2011 114 bu $154.78 2012 144 bu $331.42 2013 139 bu $62.04 2014 132 bu $77.19

33
Corn Fertilizer Costs Per Acre

34
Corn total costs on cash rented land

35
Sugar Beet Yield

36
Cost Per Acre for Sugar Beets on Cash Rented Land

37
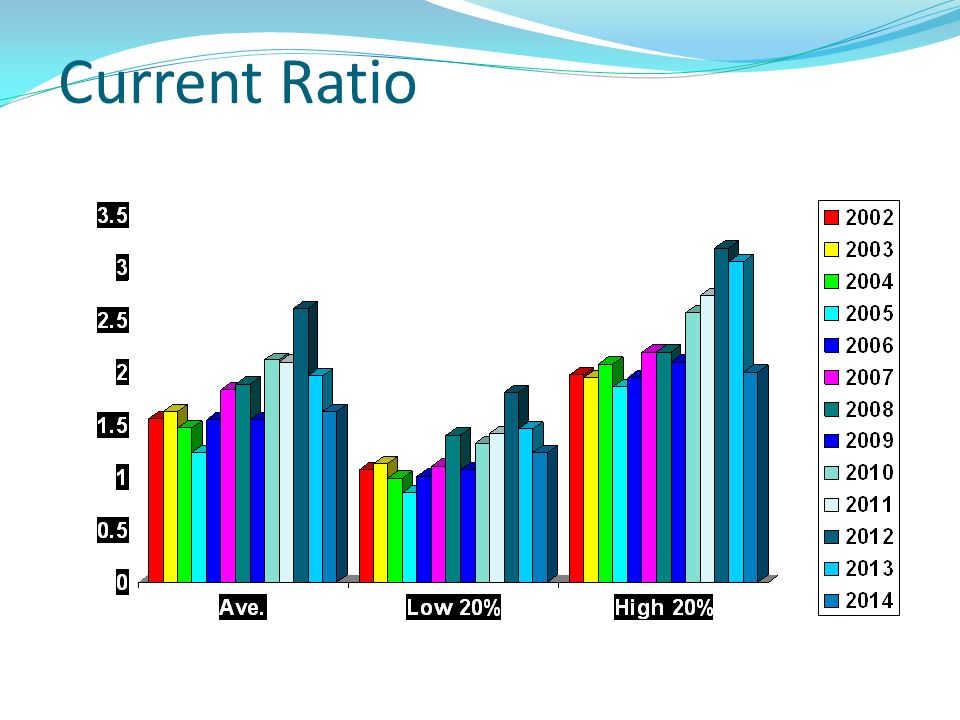
Current Ratio

39
Average Working Capital

40
Working Capital/Group

41
Rate of Return on Equity/Year (Cost)
")
42
Rate of Return on Equity/Group

43
Capital Replacement Dollars/Year decreased for each group

44
Capital Replacement Dollars/Group

45
Operating Expense Ratio/Year

46
Operating Expense Ratio increased in all three profit groups

47
Net Farm Income/Year

48
Net Farm Income/Group

49
Conclusions about the ratios Start to compare your information to the last 3 to 5 years of data. Determine your own trend lines. Compare your data to the area averages. How does your business stack up? Evaluate possible changes if needed. Consider the following flow chart in making future business decisions

50
Flowchart for Assessing and Improving Farm Profitability ASSET TURNOVER Needs Improvement Acceptable If both asset turnover and operating profit are at acceptable levels, then increase size Look for ways to increase the revenues generated from existing assets. Re-evaluate: Thruput Crop Mix/Product Mix Marketing Program Yields Resource Use Custom Work Enterprise Look for non-performing/under-performing assets to cull. Re-evaluate: Leasing versus Owning Assets Custom Work versus Owning Underutilized Machinery Sharing Assets (Partnering) Re-evaluate: Production Costs Rents Capital Spending Plans Purchasing Practices Family Needs Business Organization Financing Costs Employment Inventory Management Outsourcing Records Control Procedures Management’s Priorities Look at cost controls. Look for ways to decrease expenses without reducing revenues. Operating Profit Margin Needs Improvement Source: Purdue University
 Re-evaluate: Production Costs Rents Capital Spending Plans Purchasing Practices Family Needs Business Organization Financing Costs Employment Inventory Management Outsourcing Records Control Procedures Management’s Priorities Look at cost controls. Look for ways to decrease expenses without reducing revenues. Operating Profit Margin Needs Improvement Source: Purdue University.")
51
Where are we headed? Major increase in the use technology. Precision agriculture Biotechnologies (Livestock & Crops) Internet Find new Suppliers, products, markets Evaluating new technologies or products E-Commerce Are you working with partners to use capital more efficiently? Is your business a low cost producer? How about value added industries???
 Internet Find new Suppliers, products, markets Evaluating new technologies or products E-Commerce Are you working with partners to use capital more efficiently. Is your business a low cost producer. How about value added industries .")
52
For more information in Minnesota contact Ron Dvergsten Northland Community and Technical College 218-683-8747 In North Dakota Call the CTE Agriculture Supervisor @ 701-328-3162 For More Information

53
Thank You

Similar presentations

 and.>")


