Download presentation
Presentation is loading. Please wait.

1
i.e…“The stuff from the first bit of your book that you need to know right now.” Data is information that is collected. Qualitative (attribute) data refers to non – numerical data. Intro to Probability and Statistics
 data refers to non – numerical data. Intro to Probability and Statistics.")
2
Quantitative (numerical) data represents numerical observations. It falls into two classes: Data that is counted is called discrete. Data that is measured is called continuous.

3
Descriptive statistics describes data that has been collected. 2012 US Presidential Election electoral results (by state) Barack Obama (50.6% popular, 61.7% electoral) Mitt Romney (47.8% popular, 38.3% electoral)
 Barack Obama (50.6% popular, 61.7% electoral) Mitt Romney (47.8% popular, 38.3% electoral).")
4
Descriptive statistics describes data that has been collected. 2012 US Presidential Election electoral results (by state, weighted by population) Barack Obama (50.6% popular, 61.7% electoral) Mitt Romney (47.8% popular, 38.3% electoral) Delaware – 900,000 Wyoming – 600,000
 Barack Obama (50.6% popular, 61.7% electoral) Mitt Romney (47.8% popular, 38.3% electoral) Delaware – 900,000 Wyoming – 600,000.")
5
Descriptive statistics describes data that has been collected. 2012 US Presidential Election electoral results (by county) Barack Obama (50.6% popular, 61.7% electoral) Mitt Romney (47.8% popular, 38.3% electoral)
 Barack Obama (50.6% popular, 61.7% electoral) Mitt Romney (47.8% popular, 38.3% electoral).")
6
Descriptive statistics describes data that has been collected. 2012 US Presidential Election electoral results (by county, weighted by population) Barack Obama (50.6% popular, 61.7% electoral) Mitt Romney (47.8% popular, 38.3% electoral)
 Barack Obama (50.6% popular, 61.7% electoral) Mitt Romney (47.8% popular, 38.3% electoral).")
7
Descriptive statistics describes data that has been collected. 2012 US Presidential Election electoral results (by county, “shades of purple”) Barack Obama (50.6% popular, 61.7% electoral) Mitt Romney (47.8% popular, 38.3% electoral)
 Barack Obama (50.6% popular, 61.7% electoral) Mitt Romney (47.8% popular, 38.3% electoral).")
8
Descriptive statistics describes data that has been collected. 2012 US Presidential Election electoral results (by county, “weighted shades of purple”) Barack Obama (50.6% popular, 61.7% electoral) Mitt Romney (47.8% popular, 38.3% electoral)
 Barack Obama (50.6% popular, 61.7% electoral) Mitt Romney (47.8% popular, 38.3% electoral).")
9
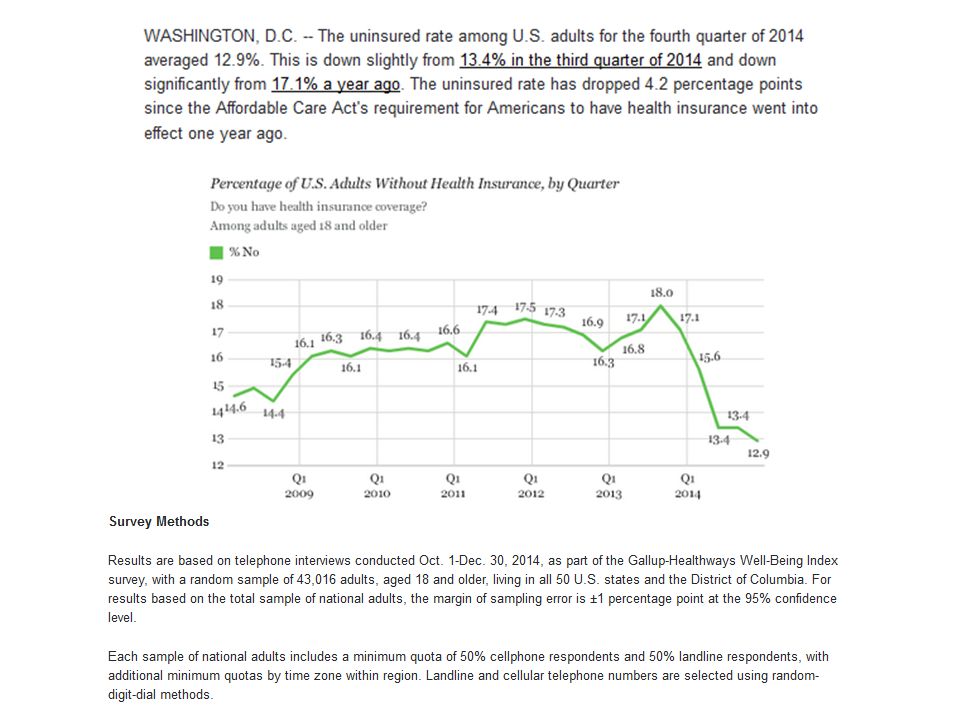
Inferential statistics makes predictions, based on a random sample taken from a population.

10
To approximate a parameter (a measure of a population) we measure a statistic (the related characteristic of a sample) with its corresponding margin of error.
 we measure a statistic (the related characteristic of a sample) with its corresponding margin of error.")
13
How should we present our data? A company hires a statistician who samples 20 employees randomly, and records how many products each produces in one week: 10161930171635291518 21202614182830391921

14
I.Frequency Distribution Left column possible data values Broken into equally spaced classes Right column frequency of occurrence of classes 10161930171635291518 21202614182830391921

15
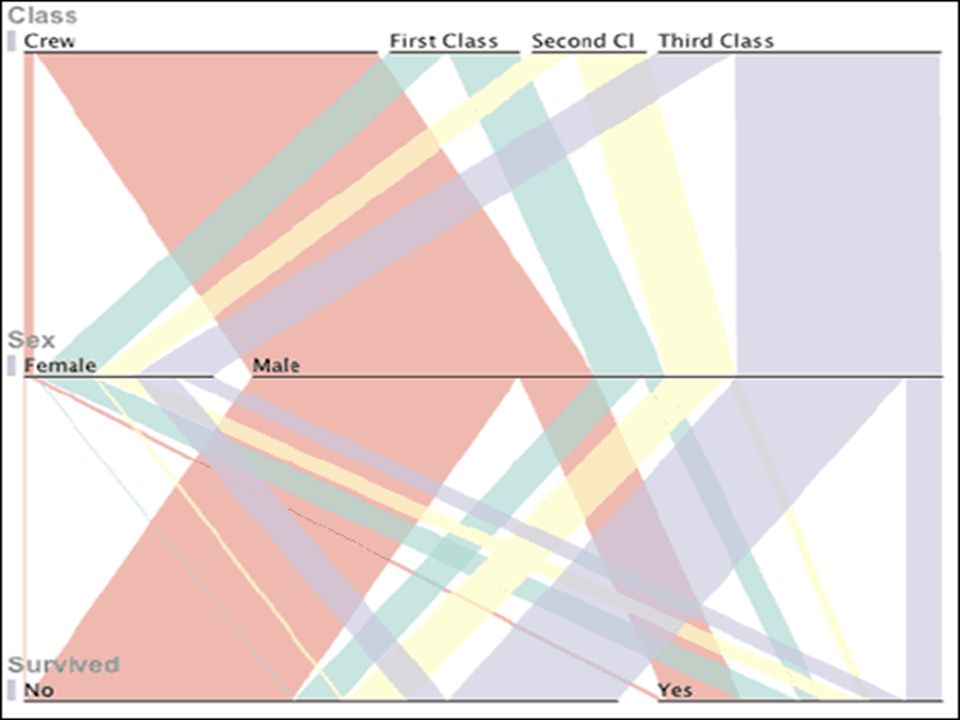
Frequency Histogram II. Frequency Histogram A picture of the frequency distribution Visual Displays of Information (an introduction)
.")
16
Other Types of Displays Pareto Diagram (or Pareto Chart) “finger” “refused” “dedicated”
 finger refused dedicated")
17
My father was slaughtered by a six fingered man. He was a great sword maker, my father. When the six fingered man appeared and requested a special sword, my father took the job. He slaved a year before it was done. The six fingered man returned and demanded it, but at one tenth his promised price. My father refused. Without a word, the six fingered man slashed him through the heart. I loved my father. So naturally, I challenged his murderer to a duel. I failed. The six fingered man left me alive, but he gave me these. I was eleven years old, and when I was strong enough, I dedicated my life to the study of fencing. So the next time we meet, I will not fail. I will go up to the six fingered man and say, "Hello. My name is Inigo Montoya. You killed my father. Prepare to die."

18
Visual Displays of Information (an introduction) Other Types of Displays Stem and Leaf Plot (Stem Plot) Dot Plot Others? Pareto Diagram (or Chart)
.")
26
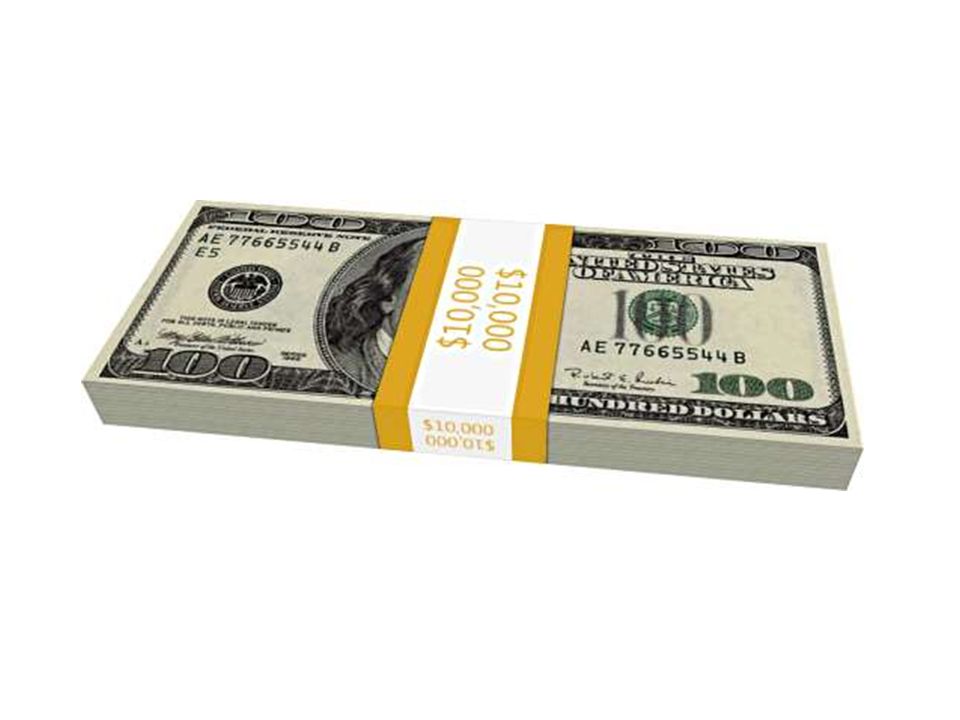
One million dollars (100 of the previous packets)
")
27
One hundred million dollars (100 of the previous stacks... on a pallet, for easy maneuverability!)
")
28
One billion dollars (10 of the previous palleted stacks)
")
29
One trillion dollars (make sure you see the guy over there...and the pallets are stacked two high)...
...")
30
...and here’s our national debt as of March 2009.

35
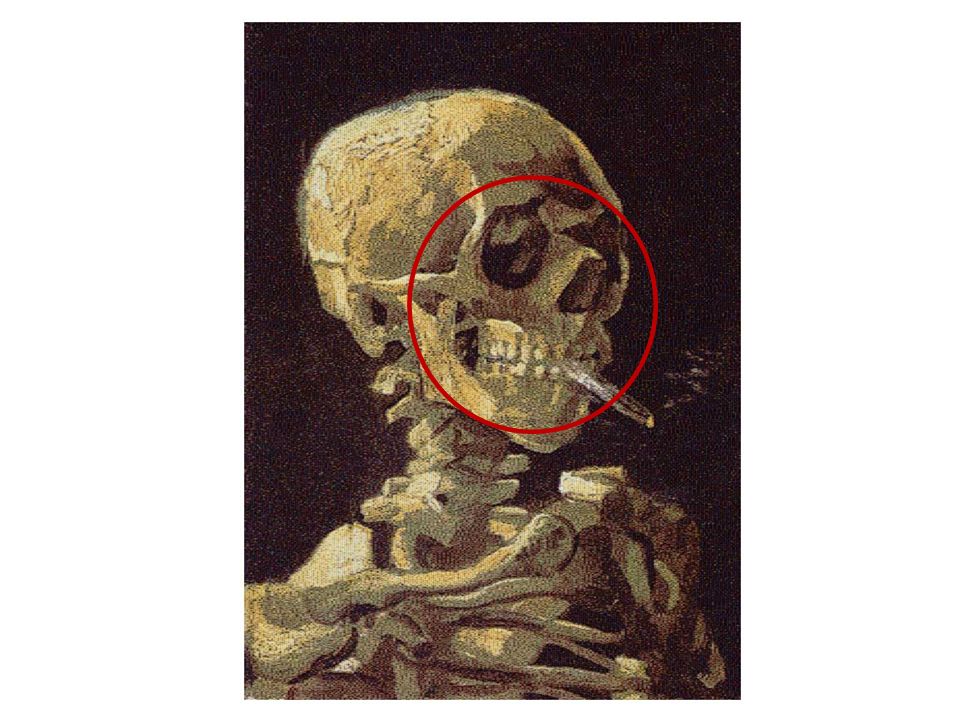
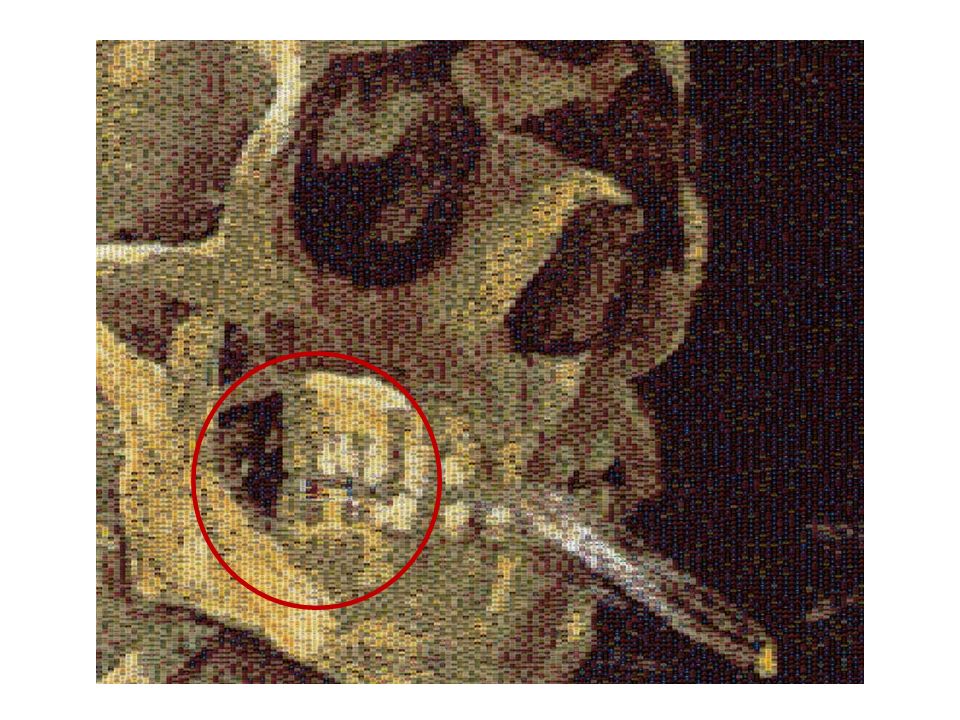
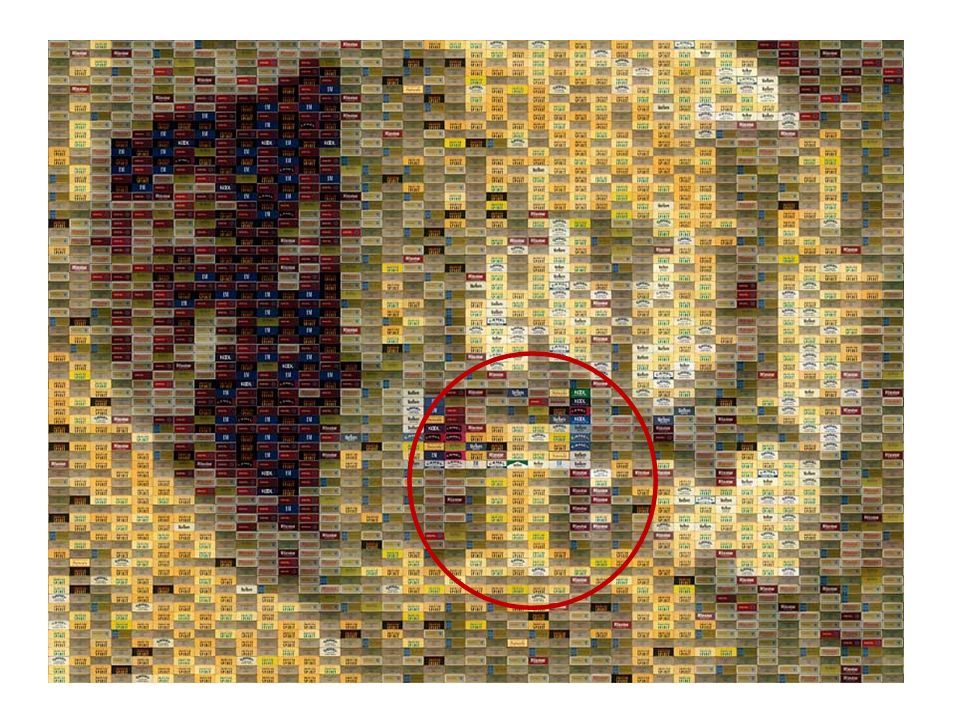
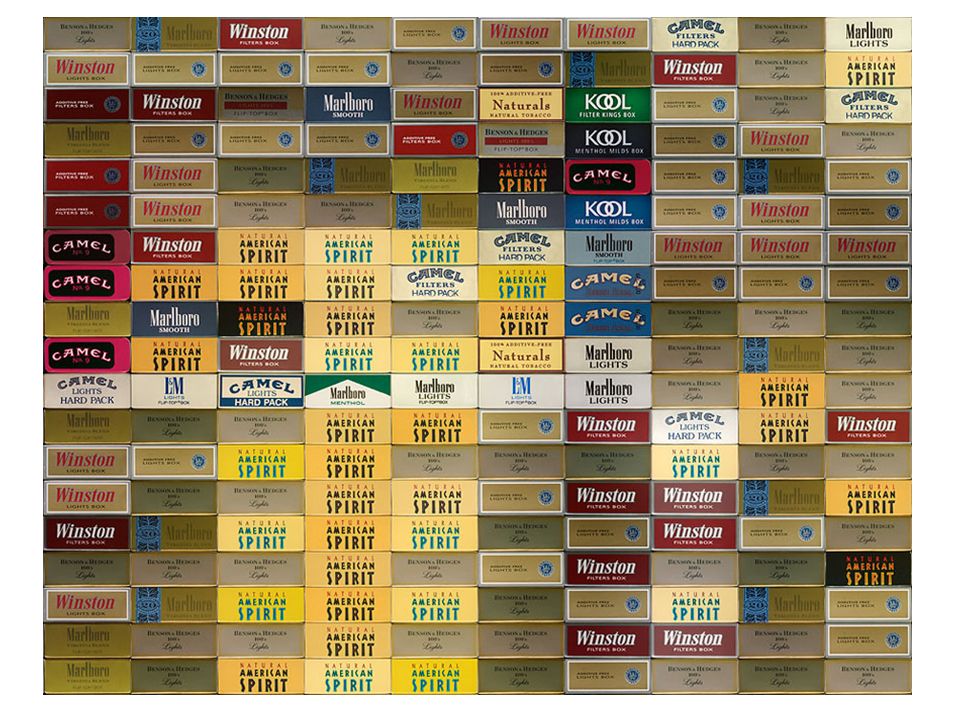
Chris Jordan: Skull With Cigarette, 2007...based on a painting by Van Gogh... 200,000 packs of cigarettes, equal to the number of Americans who die from cigarette smoking every six months. www.chrisjordan.com

36
Visual Displays of Information (an introduction) One Last Thing... How many keys do you have with you today? (I’ll bring a histogram next time) Homework for Intro To Probability and Statistics
 Homework for Intro To Probability and Statistics.")
Similar presentations