Download presentation
Presentation is loading. Please wait.

1
Lecture 2 ASTR 111 – Section 002 Introductory Astronomy: Solar System Dr. Weigel

2
Reading for this week –The reading for this week is Chapter 1 (all) and Chapter 2 (sections 2.1-2.2 only) –The quiz will cover this reading and the topics covered in this week’s lectures –The quiz will be available on BlackBoard at 10:15 am
 and Chapter 2 (sections only) –The quiz will cover this reading and the topics covered in this week’s lectures –The quiz will be available on BlackBoard at 10:15 am")
3
Outline Angular Measurements Review Accuracy, Precision, and Bias The Scientific Method Astronomical Distances Ancient Astronomy

4
1.What is the angular distance between points A and B on this slide (In degrees and arcminutes). Each student should take their own measurement. Each student should also write down their height alongside of their measurement. 2.Predict what will happen if you made your measurement in two different parts of the room. 3.Next week you sit in the same chair but weigh 30 pounds less. Will your (angular) measurements change? 4.Do you think there will be a relationship between a persons height and the angle they measure? A B
 measurements change. 4.Do you think there will be a relationship between a persons height and the angle they measure. A B.")
5
http://antwrp.gsfc.nasa.gov/apod/ap071025.html

6
Outline 1.Angular Measurements 2.Accuracy, Precision, and Bias 3.The Scientific Method 4.Astronomical Distances 5.Ancient Astronomy

7
Precision, Accuracy, and Bias Whenever you take measurements, you should account for them Fundamental terms that you must understand when interpreting measurements

8
Accuracy vs. Precision Target is red Shots are black

9
Accuracy vs. Precision Target is red Shots are black High precision Low accuracy High precision High accuracy

10
Accuracy vs Precision Mnemonic: You’ll get an A for Accuracy

11
Bias Target is red Shots are black The left target shows bias – the measurements were made with high precision, but the were consistently “off” in the same direction.

12
Summary Accuracy – all measurements or values are clustered around the true value (you’ll get an A for accuracy, because you are on the true value) Precision – all measurements are clustered but are not centered on true value Bias – measurements are not centered on true value No bias Center of red dot is true value
 Precision – all measurements are clustered but are not centered on true value Bias – measurements are not centered on true value No bias Center of red dot is true value")
13
Group work (~ 4 minutes) 1.Draw a diagram like the ones on the previous slide that show 1.Low precision and high bias 2.High accuracy and very low precision 2.On a piece of paper, write down Possible causes of low accuracy – be specific! (Don’t say “human error”) Possible causes of bias – be specific! associated with your angular measurements
 Possible causes of bias – be specific. associated with your angular measurements.")
14
Which diagram best represents the statement: “Preliminary polling results indicated that Obama won Virginia by a landslide because the preliminary poll results were all from Northern Virginia”. Group work (~ 3 minutes) A B C D
 A B C D.")
15
Outline 1.Angular Measurements 2.Accuracy, Precision, and Bias 3.The Scientific Method 4.Astronomical Distances 5.Ancient Astronomy

16
The Scientific Method

17
What is Science? 1)A set of facts 2)Something that professional scientists do 3)The underlying Truth about the Universe 4)The collection of data and formation of a hypothesis 5)None of the above
A set of facts 2)Something that professional scientists do 3)The underlying Truth about the Universe 4)The collection of data and formation of a hypothesis 5)None of the above.")
19
The Scientific Method the process characterization of existing data formulation of a hypothesis formulation of a predictive test experimental testing, (important: error elimination and characterization) report and peer review validate or revise hypothesis
 report and peer review validate or revise hypothesis")
20
Outline 1.Angular Measurements 2.Accuracy, Precision, and Bias 3.The Scientific Method 4.Astronomical Distances 5.Ancient Astronomy

21
Parallax

22
102030405060708090

23
Parallax When the apparent position of an object (numbers on speedometer) changes because of the change in position of the observer (driver’s seat to passenger’s seat).
 changes because of the change in position of the observer (driver’s seat to passenger’s seat).")
24
The Parsec

25
Astronomical distances are never measured in Car hours, dotsecs, and Moon Units Car Hour (ch) –the distance a car can travel in one hour at a speed of about 60 miles/hour. How far is Baltimore? About an hour. Car Year (cy) –the distance a car can travel in one year at a speed of about 60 miles/hour dotsec (ds) –the distance at which the two dots on the screen subtend an angle of 1 arcsec Moon Unit (MU) –One Moon Unit is the average distance between Earth and the Moon A distance A time
 –the distance a car can travel in one year at a speed of about 60 miles/hour dotsec (ds) –the distance at which the two dots on the screen subtend an angle of 1 arcsec Moon Unit (MU) –One Moon Unit is the average distance between Earth and the Moon A distance A time.")
26
Astronomical distances are often measured in astronomical units, parsecs, or light-years Light Year (ly) –One ly is the distance light can travel in one year at a speed of about 3 x 10 5 km/s or 186,000 miles/s Parsec (pc) –the distance at which 1 AU subtends an angle of 1 arcsec or the distance from which Earth would appear to be one arcsecond from the Sun Astronomical Unit (AU) –One AU is the average distance between Earth and the Sun –1.496 X 10 8 km or 92.96 million miles
 –One ly is the distance light can travel in one year at a speed of about 3 x 10 5 km/s or 186,000 miles/s Parsec (pc) –the distance at which 1 AU subtends an angle of 1 arcsec or the distance from which Earth would appear to be one arcsecond from the Sun Astronomical Unit (AU) –One AU is the average distance between Earth and the Sun –1.496 X 10 8 km or million miles")
27
Observer’s view of Sun and Earth from outer planet SunEarth

28
“ Observer’s view Gods-eye view - Looking down on Sun and Earth

29
Observer’s view Gods-eye view

30
Group Problem Form groups of exactly 4 Optimal configuration is two students in one row and two students in another row No Yes

31
1.Imagine that you are looking at the stars from Earth in January. Use a straightedge to draw a line from Earth in January, through the nearby star (Star A), out to the Distant Stars. Which of the distant stars would appear closest to Star A in your night sky in January. Circle this distant star and label it Jan. 2.Repeat Question 1 for July and label the distant star “July”. 3.In the box below, the same distant stars are shown as you would see them in the night sky. Draw a small x to indicate the position of Star A as seen in January and label it “Star A Jan.” 4.In the same box, draw another x to indicate the position of Star A as seen in July and label it “Star A July”. 5.Describe how Star A would appear to move among the distant stars as Earth orbits the Sun counterclockwise from January of one year, through July, to January of the following year. 6.Consider two stars (C and D) that both exhibit parallax. If Star C appears to move back and forth by a greater amount than Star D, which star do you think is actually closer to you? If you’re not sure, just make a guess. We’ll return to this question later in this activity. Earth (January) Earth (July) Nearby Star (Star A) Based on Lecture Tutorials for Introductory Astronomy, Prather et al., pg 35 Distant Stars 1 AU
, out to the Distant Stars. Which of the distant stars would appear closest to Star A in your night sky in January. Circle this distant star and label it Jan. 2.Repeat Question 1 for July and label the distant star July . 3.In the box below, the same distant stars are shown as you would see them in the night sky. Draw a small x to indicate the position of Star A as seen in January and label it Star A Jan. 4.In the same box, draw another x to indicate the position of Star A as seen in July and label it Star A July . 5.Describe how Star A would appear to move among the distant stars as Earth orbits the Sun counterclockwise from January of one year, through July, to January of the following year. 6.Consider two stars (C and D) that both exhibit parallax. If Star C appears to move back and forth by a greater amount than Star D, which star do you think is actually closer to you. If you’re not sure, just make a guess. We’ll return to this question later in this activity. Earth (January) Earth (July) Nearby Star (Star A) Based on Lecture Tutorials for Introductory Astronomy, Prather et al., pg 35 Distant Stars 1 AU.")
34
Outline 1.Angular Measurements 2.Accuracy, Precision, and Bias 3.The Scientific Method 4.Astronomical Distances 5.Ancient Astronomy

35
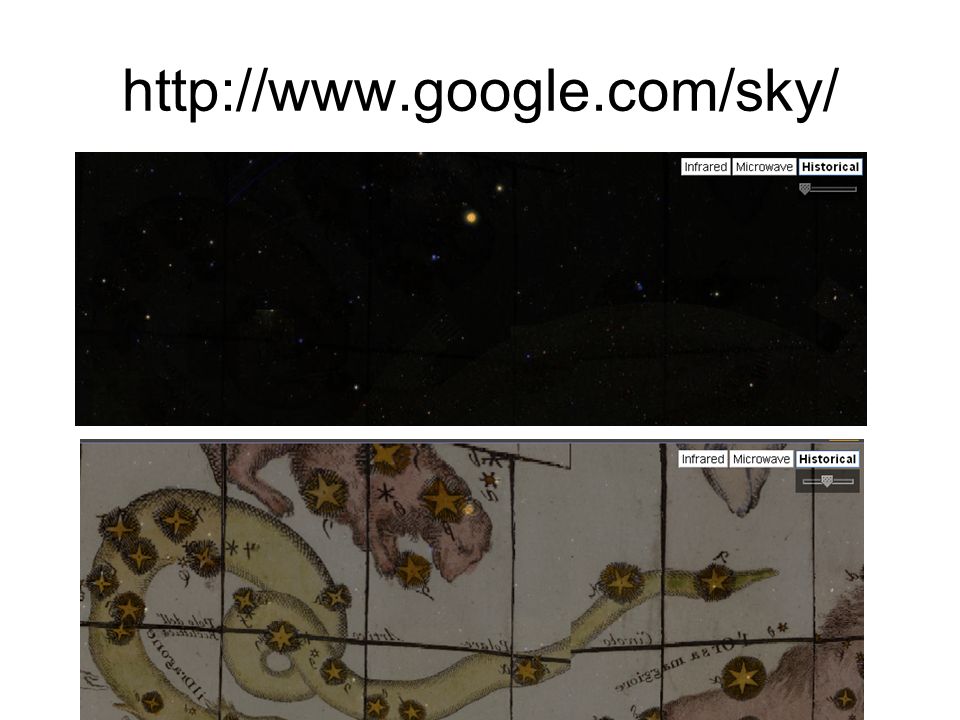
http://www.google.com/sky/
36
Naked-eye astronomy had an important place in ancient civilizations Positional astronomy –the study of the positions of objects in the sky and how these positions change Naked-eye astronomy –the sort that requires no equipment but human vision Extends far back in time –British Isles Stonehenge –Native American Medicine Wheel –Aztec, Mayan and Incan temples –Egyptian pyramids

37
Stonehenge http://archaeoastronomy.wordpress.com/2005/06/15/stonehenge-astronomy-ii-solar-alignments/ See also http://news.bbc.co.uk/2/hi/uk_news/england/wiltshire/7465235.stm

38
Aztec, Mayan and Incan temples

39
Eighty-eight constellations cover the entire sky Ancient peoples looked at the stars and imagined groupings made pictures in the sky We still refer to many of these groupings Astronomers call them constellations (from the Latin for “group of stars”)
")
40
Modern Constellations On modern star charts, the entire sky is divided into 88 regions Each is a constellation Most stars in a constellation are nowhere near one another They only appear to be close together because they are in nearly the same direction as seen from Earth

Similar presentations


