Download presentation
Presentation is loading. Please wait.

1
Species extrapolation with PBPK models
Kannan Krishnan Université de Montréal, Canada

2
Outline Introduction Rat-Human extrapolation Rat-Fish extrapolation
Single chemicals Mixtures QSARs Rat-Fish extrapolation PBPK modeling Conclusions

3
PBPK Models and Interspecies Extrapolation
Adipose tissue Richly perfused tissues Liver Poorly perfused Lungs Inhaled Exhaled C RAT PBPK Program T HUMAN C RAT or HUMAN T SIMULATIONS INPUT PARAMETERS STRUCTURE

4
Functional Representation
Amount Blood flow to tissue, volume, partition coefficient

5
Functional Representation Metabolic Clearance
Vmax = maximum velocity of metabolism Km = Michaelis-Menten constant C = concentration of chemical Metabolizing enzyme, its levels, tissue volume

6
Interspecies extrapolation of PK of chemicals
Species SPECIFIC: Species SPECIFIC: INVARIANT: Blood:air PC Flows Volumes [P-450] Vmaxc Km Tissue:air PC Blood:air PC Flows Volumes [P-450]

7
Mixture PBPK Models and Interspecies Extrapolation
Arterial blood Fat Lungs Poorly perfused tissues Richly perfused Liver metabolism Venous blood A B C D E A B C D E C RAT Computer Program T HUMAN C RAT or HUMAN T SIMULATIONS INPUT PARAMETERS STRUCTURE

8
QSARs for PBPK Parameters
Fragment constant approach Ppbpk = nf·Cf Multilinear regression (SPSS®) 46 VOCs, Fragments: CH3, CH2, CH, C, C=C, H, Cl, Br, F, B-ring, 2 E1 substrates Cross-validation, external validation
 46 VOCs, Fragments: CH3, CH2, CH, C, C=C, H, Cl, Br, F, B-ring, 2 E1 substrates. Cross-validation, external validation.")
9
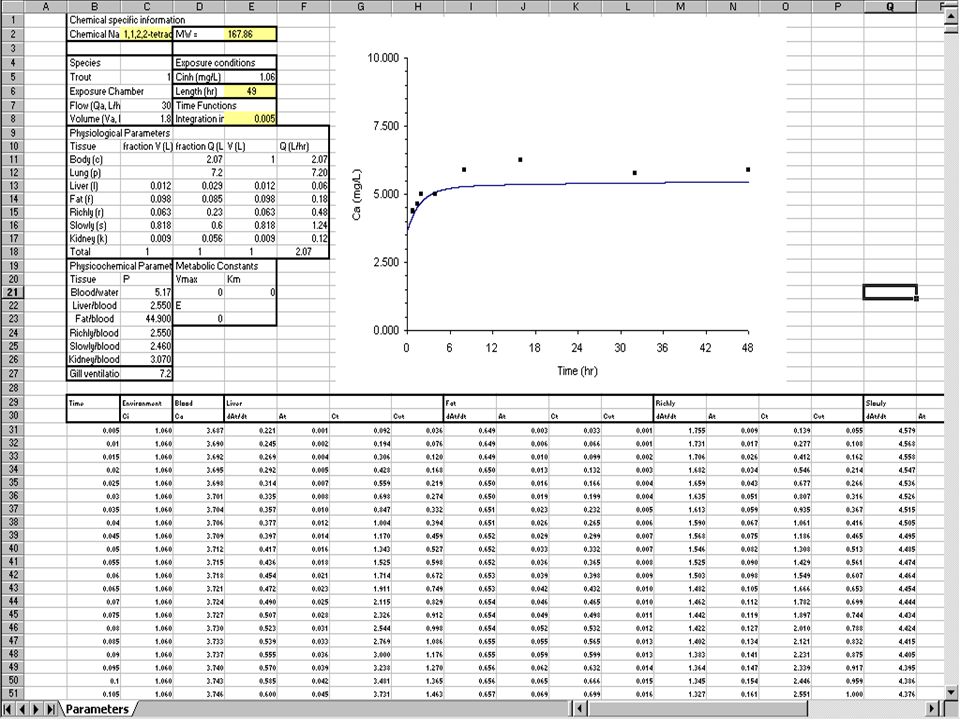
Structure Input @Chemical Exposure Condition Yellow Indicates User Input

10
QSAR/PBPK model – Ethyl benzene

11
QSAR/PBPK model:Dichloromethane

12
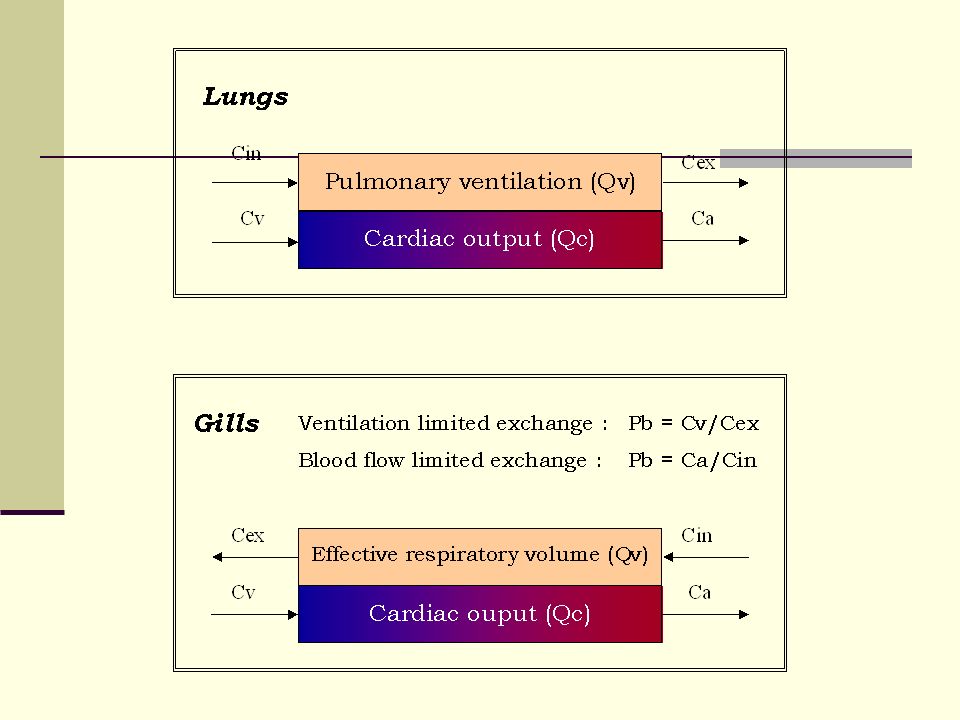
Conceptual Representation
Inspired chemical Expired chemical Venous Blood Arterial Blood Rest of Body Kidneys Muscle Liver Gills

14
Partition Coefficients
Tissue:water PCs Determinants of bioconcentration factors May vary between species (rat vs fish), if the composition of tissues change from one species to another Tissue components: lipids, water, proteins Lipids (neutral, phospho) + water
, if the composition of tissues change from one species to another. Tissue components: lipids, water, proteins. Lipids (neutral, phospho) + water.")
15
Tissue composition based Computation of PCs
Po:e = n-octanol:env partition coefficient Pt:e = tissue:env partition coefficient Fnt = volume fraction of neutral lipids in tissue Fpt = volume fraction of phospholipids in tissue Fwt = volume fraction of water in tissue

16
Interspecies differences in mechanistic determinants (PCs)
Tissue and species Neutral lipid eqvt Water eqvt Muscle Rat 0.0117 0.7471 Human 0.0378 0.7573 Catfish 0.0041 0.7960 FHM 0.0194 0.8116 Trout 0.0244 0.7746

17
Interspecies extrapolation of tissue:air partition coefficients (Humans)
Y = 0.992X R2 = 0.969 Y = 0.973X R2 = 0.933 Y = 0.886X

18
Interspecies extrapolation of tissue:air partition coefficients (Fish)
")
19
Application (chloroethane)
CL H H Log Poa = 0.373 +0.433 = 1.6 Log Pwa = -0.225 = 0.215 Rat Pla 0.0425 * 0.7176 * = 2.87 Trout Pla 0.0261 * 0.7649 * = 2.29

20
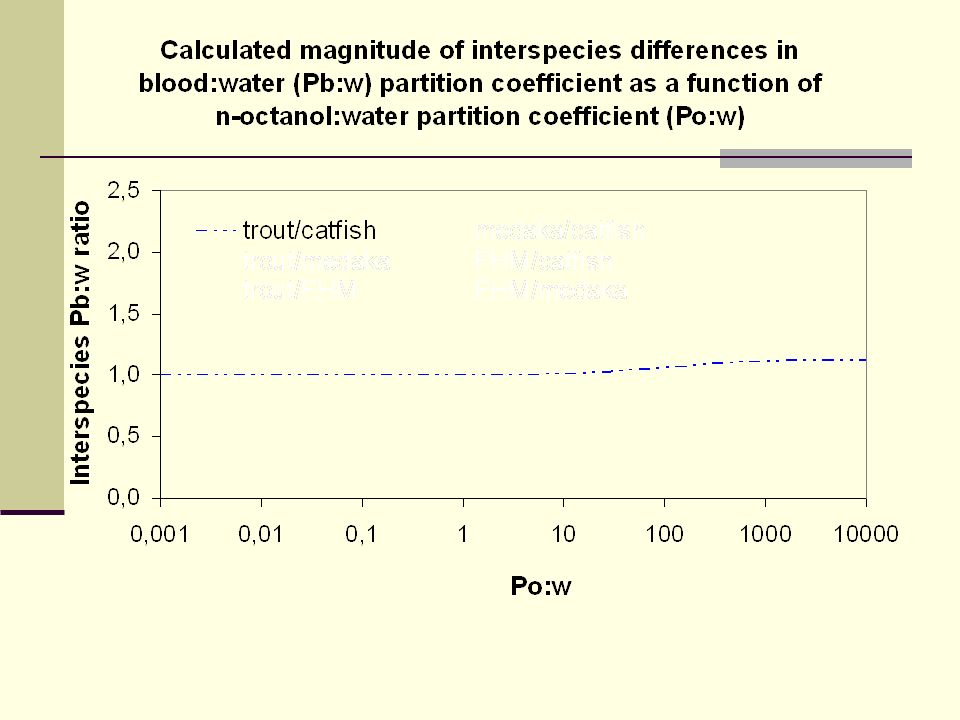
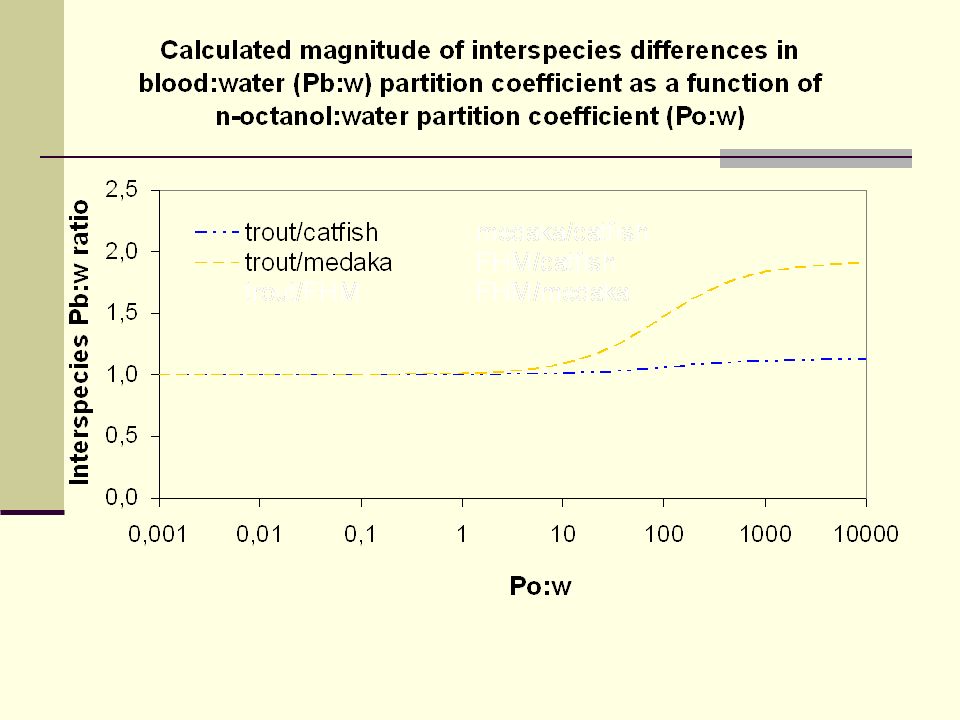
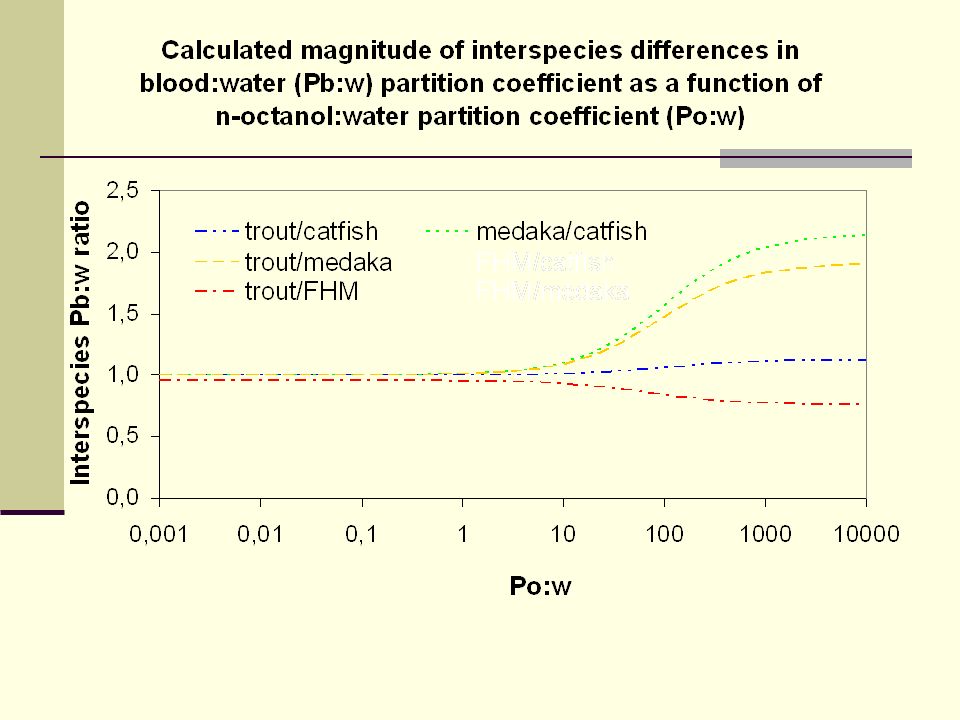
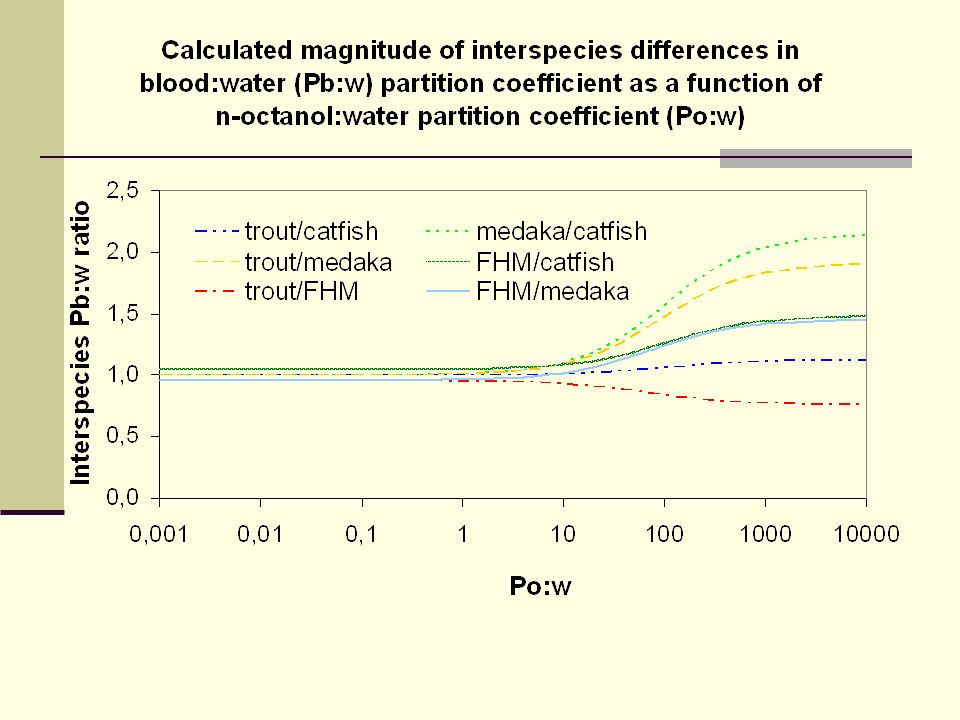
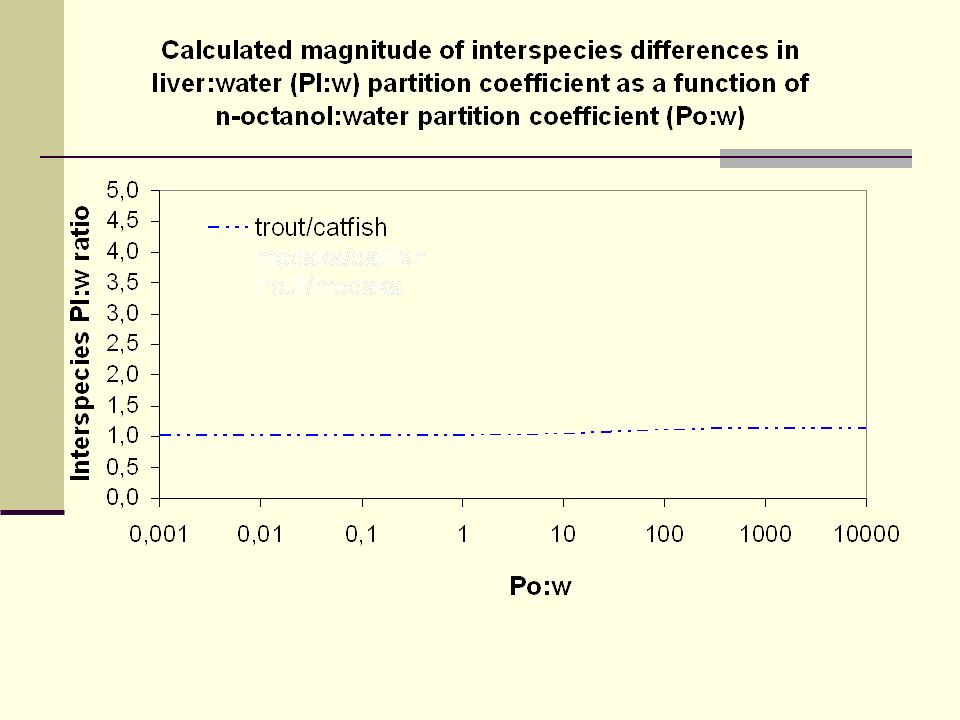
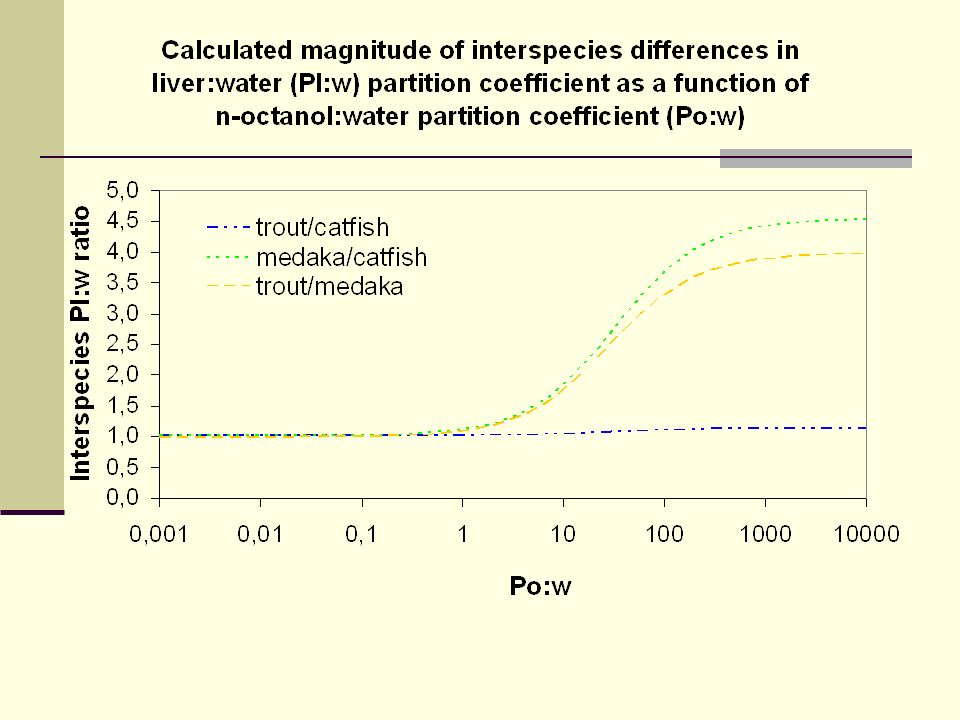
Magnitude of Interspecies Differences in Tissue:Water PCs
Po :w = n-octanol:water partition coefficient Pt :a = tissue:water partition coefficient Fnt = volume fraction of neutral lipids in tissue Fpt = volume fraction of phospholipids in tissue Fwt = volume fraction of water in tissue A & B = two differents species

30
Interspecies extrapolation of metabolism constants
Vmax in one species Allometrically scale to another species Assume Km to be species invariant Worked well for CYP2E1 subtrates

31
Structure-Metabolic Constants Relationship Modeling
Structural feature Log Vmaxc Log Km AC .734 .382 CL .612 .569 BR .810 .296 H (on C=C) .453 .584 CH3 .795 7.08E-2 CH2 .269 -.320 CH -.211 -.845 C -1.451 -1.544 C=C -. 353 -2.07 R2 0.947 0.752 PRESS/SSY 0.10 0.89
 CH E-2. CH CH C C=C R PRESS/SSY")
32
Application (chloroethane)
CL H H Log Km = 0.071 - 0.32 = 0.26 vs 0.19 µM Log Vmaxc = 0.795 = vs 1.79 Human (BW=70 kg) = 937 µmol/hr * BW0.7 Rat (BW=0.25 kg) = 18.1 µmol/hr
 = 937 µmol/hr * BW0.7. Rat (BW=0.25 kg) = 18.1 µmol/hr.")
33
Interspecies extrapolation of metabolism constants
Turnover rate for one species CYP concentration + tissue volume Interspecies extrapolation of Vmax… Current approach: Classification of substrates (molecular volume, log P) Isozyme-specific substrates ( in vitro QSARs) Species extrapolation based on protein [C] and tissue volume
 Isozyme-specific substrates ( in vitro QSARs) Species extrapolation based on protein [C] and tissue volume.")
34
Interspecies extrapolation of PK of organic chemicals
Species SPECIFIC: Species SPECIFIC: INVARIANT: Fluid PCs Flows Volumes Enzyme [C] Vmaxc Km Blood:air PC Flows Volumes Enzyme [C]

35
QSAR-PBPK Modeling Physiology Parameters Equations Rat Simulations

36
QSPR-PBPK Modeling: Interspecies extrapolation of tissue concentrations
5 10 15 20 25 30 35 Time (hr) Tissue concentration (mg/L) Catfish FHM Trout Rat Human
 Tissue concentration (mg/L) Catfish. FHM. Trout. Rat. Human.")
38
QSARs – An alternative paradigm
DOSE EFFECT QSAR Tissue dose or Blood Conc. QSAR PK PD Relative contribution of the TK and TD processes Extrapolations based on TK determinants

39
Conclusions Interspecies differences in metabolic clearance and volume of distribution can be examined using mechanism-based QSARs PBPK modeling uniquely allows the integration of such QSARs to simulate interspecies differences in PK profiles QSAR-PBPK models facilitate internal dose based risk assessment in multiple species(lethal and non-lethal effects)
")
40
Frågor ?

Similar presentations


>")


 May 7, 2013 Conrad Housand>")
 if given parenterally, they should.>")

 Comparative Molecular Field Analysis (CoMFA) Gijs Schaftenaar.>")


