Download presentation
Presentation is loading. Please wait.

1
International Symposium on Demographic Change and Policy Response 13-14 November 2014, Beijing, China INDIA’S PROPOSED UNIVERSAL HEALTH COVERAGE POLICY: EVIDENCE AND IMPLICATIONS FOR AGE STRUCTURE TRANSITION EFFECTS AND FISCAL SUSTAINABILITY M.R. Narayana Institute for Social and Economic Change Bangalore, India 13 November 2014

2
Gratitude Professors Ronald Lee and Andrew Mason for the opportunity to present and participate in this international symposium, and for professional help and encouragement Professor Sang-Hyop Lee for constructive suggestions Professor Young Jun Chun for valuable technical guidance and support for calculation of GA for India Dr Tim Miller and Dr Carl Mason for providing me with health expenditure projections for India based on Lee-Carter model on forecasting mortality rates

3
Recent works WHO. (2013). Research on Universal Health Coverage. World Health Report 2013, World Health Organization (Luxembourg) Stabile, Mark., and Thomson, Sarah. (2014). The Changing Role of Government in Financing Health Care: An International Perspective, Journal of Economic Literature, 52(2), 480-518
 Stabile, Mark., and Thomson, Sarah. (2014). The Changing Role of Government in Financing Health Care: An International Perspective, Journal of Economic Literature, 52(2),")
5
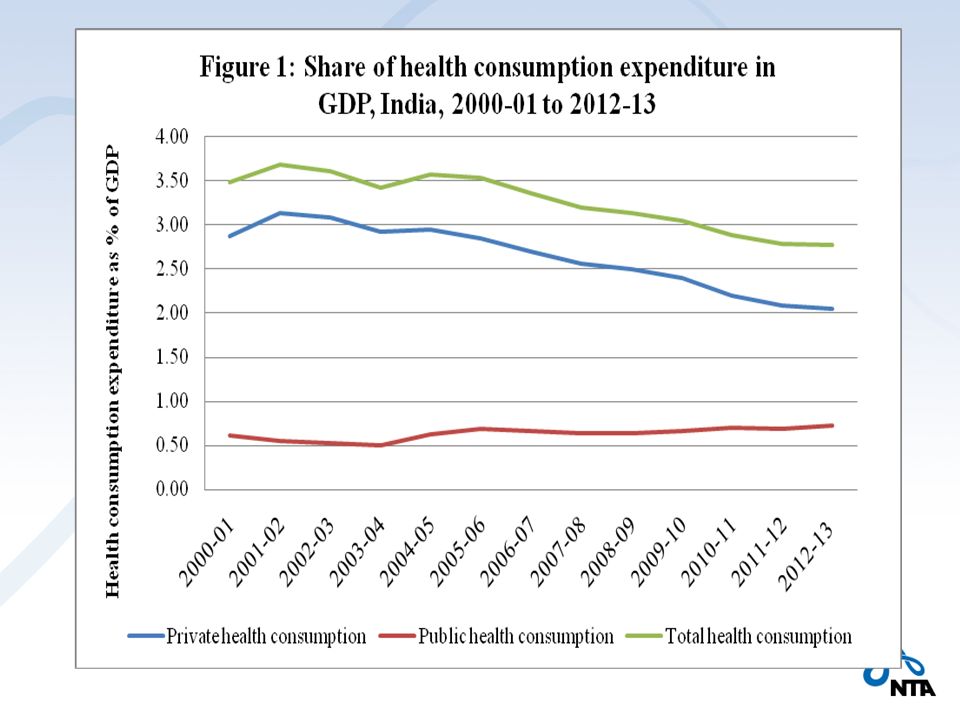
YearPublic health expenditure Share of health expenditure in aggregate public expenditure (%) Share of health expenditure in GDP (%) Total (INR billion) Share of States (%) Share of revenue expenditure (%) TotalRevenue 2000-01 30079.1489.844.844.901.38 2001-02 31577.8789.724.594.661.34 2002-03 32976.6089.464.514.471.30 2003-04 36476.1589.244.614.441.28 2004-05 41575.7087.494.784.671.28 2005-06 48575.1787.344.758.031.31 2006-07 55775.8386.914.707.751.30 2007-08 64472.2485.354.717.661.29 2008-09 75971.6984.704.596.891.35 2009-10 93669.5387.054.757.591.44 2010-11 107167.5189.484.707.911.38 2011-12 118568.8588.084.667.761.32 2012-13*141172.8367.134.796.221.39 Table 1: Public health expenditure in India: 2000-01 to 2012-13
 Share of health expenditure in GDP (%) Total (INR billion) Share of States (%) Share of revenue expenditure (%) TotalRevenue * Table 1: Public health expenditure in India: to")
6
India’s current policy proposal for Universal Health Coverage (UHC) High Level Expert Group on Universal Health Coverage (HLEG), instituted by India’s Planning Commission: 2011 UHC refers to equitable access for all in the country to affordable, accountable, appropriate and assured quality health services (promotive, preventive, curative and rehabilitative) regardless of income level, social status, gender, caste or religion of persons. The goal of the UHC is to ensure universal entitlement for every citizen to a National Health Package (NHP) of essential primary, secondary and tertiary health care services that will be funded by the government. Under proposed UHC, people have a choice of facilities provided by public sector or contracted-in private providers (i.e. NGOs and non-profits). The private providers who opt for participation in the UHC would be required to provide at least 75 percent of out-patient and 50 percent of in-patient services to all in the NHP. The cost of these services is proposed to be reimbursed by the government.
 of essential primary, secondary and tertiary health care services that will be funded by the government. Under proposed UHC, people have a choice of facilities provided by public sector or contracted-in private providers (i.e. NGOs and non-profits). The private providers who opt for participation in the UHC would be required to provide at least 75 percent of out-patient and 50 percent of in-patient services to all in the NHP. The cost of these services is proposed to be reimbursed by the government..")
7
Proposed financing of UHC (a) Increase the share of public expenditure by Central and State governments from 1.2 per cent in 2011-12 to 2.2 per cent of GDP in 2016- 17 and to 3 per cent by 2022; (b) Use general taxation as the principle source of health care funding; and (c) Not to use insurance companies or any other independent agencies to purchase health care services on behalf of the government. In terms of per capita public expenditure, the increase in public health care spending (at 2009-10 prices) is projected to grow from INR675 in 2011-12, INR1975 in 2016-17 and INR3450 in 2022. This projection (without age specificities) is based on the assumptions that total (public + private) health expenditure would remain at 4.5 per cent of GDP, a real growth rate of GDP at 8 per cent at 2009-10 prices and projected population totals by the Registrar General of India.
 is projected to grow from INR675 in , INR1975 in and INR3450 in This projection (without age specificities) is based on the assumptions that total (public + private) health expenditure would remain at 4.5 per cent of GDP, a real growth rate of GDP at 8 per cent at prices and projected population totals by the Registrar General of India..")
8
Key policy issues in India’s proposed UHC Key research gaps in the current proposals to India’s UHC policy are lack of explicit recognition and inclusion of (a) age specific demand for the UHC by young, working and elderly population; (b) impact of age structure transition on changes in this age specific demand for UHC (c) sustainability of current fiscal policies in the presence of expected UHC policy and projected health expenditures These gaps are the key policy imperatives /issues for research in this paper.
 age specific demand for the UHC by young, working and elderly population; (b) impact of age structure transition on changes in this age specific demand for UHC (c) sustainability of current fiscal policies in the presence of expected UHC policy and projected health expenditures These gaps are the key policy imperatives /issues for research in this paper.")
9
Research questions Does demand for health services under a UHC Policy vary across ages? If so, which of the age groups (young/working/elderly) is highest demander of the services? Does age structure transition in India’s population from 2005 through 2050 and beyond have implications on demand issues in question (1) above? If so, can the changes in size of demand (or demanders) be distinguished by the age groups and over time? What are the health expenditure requirements for implementation of a proposed UHC policy? How can such expenditures be projected in future? What are fiscal options to financing a UHC policy in question (3) above? If a proposed UHC policy is entirely pubic-funded, non-means tested and non-contributory, can it be sustained by current fiscal policies? If not, what are additional conditions required to attain fiscal sustainability under the proposed UHC policy? Objective of this paper is to offer plausible answer to the above questions
 is highest demander of the services. Does age structure transition in India’s population from 2005 through 2050 and beyond have implications on demand issues in question (1) above. If so, can the changes in size of demand (or demanders) be distinguished by the age groups and over time. What are the health expenditure requirements for implementation of a proposed UHC policy. How can such expenditures be projected in future. What are fiscal options to financing a UHC policy in question (3) above. If a proposed UHC policy is entirely pubic-funded, non-means tested and non-contributory, can it be sustained by current fiscal policies. If not, what are additional conditions required to attain fiscal sustainability under the proposed UHC policy. Objective of this paper is to offer plausible answer to the above questions.")
10
Methodology Combined methodology of NTA, health expenditure projections and GA Measurement of UHC – NTA methodology A measure of age profile of UHC is calculated by combining the age profiles of public and private health consumption. This age profile is also a measure of observed demand for UHC in the benchmark year 2004-05 Consistent with the current policy proposal on UHC from consumption side GA methodology – Young’s spreadsheets Two version based on different GDP projections One version based on Mason-Miller public health expenditure projections

11
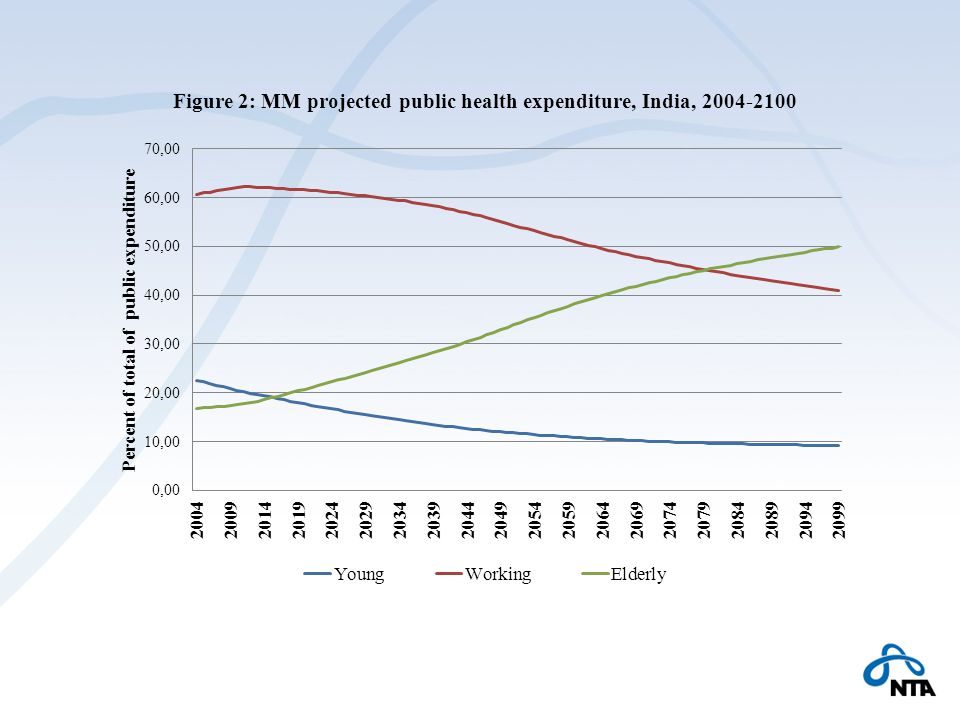
Mason and Miller health expenditure projections Mason and Miller apply the Lee-Carter model on forecasting age specific mortality rates, and show how the level and shape of spending changes as GDP/capita rises. The projection model shows the transition in health care spending by age as countries become wealthier. That is, poorer countries are projected to adopt the health care spending patterns observed in the richer countries (OECD countries) They assume that this transition takes place as GDP per capita increases. That is, as India's GDP per capita moves toward the levels observed in the high-income countries, its age pattern of spending in health care will also come to resemble that of the richer countries. This is called convergence scenario The convergence scenario is obtained by using data from 18 NTA countries – projection results are sent to all researchers in these countries
 They assume that this transition takes place as GDP per capita increases. That is, as India s GDP per capita moves toward the levels observed in the high-income countries, its age pattern of spending in health care will also come to resemble that of the richer countries. This is called convergence scenario The convergence scenario is obtained by using data from 18 NTA countries – projection results are sent to all researchers in these countries.")
13
Year of projection Projected per capita public health expenditure (INR) Projected per capita private health expenditure (INR) Projected per capita total health expenditure (INR) Planning Commission (2011) MM Projections (2014b) Planning Commission (2011) MM Projections (2014b) Planning Commission (2011) MM Projections (2014b) 2011-126755461825201425002536 2016-1719757261750283437253560 2021-22345010561725417451755229 Table 2: Comparison of public health expenditure projections for India
 Projected per capita private health expenditure (INR) Projected per capita total health expenditure (INR) Planning Commission (2011) MM Projections (2014b) Planning Commission (2011) MM Projections (2014b) Planning Commission (2011) MM Projections (2014b) Table 2: Comparison of public health expenditure projections for India")
14
Fiscal sustainability Using GA methodology, fiscal sustainability of current fiscal policies is defined by Generational Imbalance (GI) GI is measured by the difference in present value of net payment of future generation and newborn (or age-0 cohort in the benchmark year) divided by the present value of net payment of the newborn. Current fiscal policies are sustainable if the value of GI is less than zero. This means that the lifetime net payment of future generation is smaller than that of current generation. Thus, to restore the long term budgetary balance, tax burden should be reduced, or transfer benefits should be increased, in future.

15
ModelMain assumptionsComputed value of GI GDP growth rate (1) GDP growth rate (2) Baseline Model 1Real interest rate = 8.13% Productivity growth rate =3.01% 97.75111.15 Baseline Model 2Same as Baseline Model 1 except population age structure in 2005 remains the same for all years 64.98 Baseline Model 3Same as Baseline Model 1 except the productivity growth rate = 1.5% 89.01104.05 Baseline Model 4Same as Baseline Model 2 except the productivity growth rate =1.5% 100.83 Baseline Model 5Same as Baseline Model 1 except the interest rate = 12% 97.60113.60 Baseline Model 6Same as Baseline Model 2 except the interest rate = 12% 115.49116.49 Table 3: Sustainability of current fiscal policies: Basic results of baseline models
 GDP growth rate (2) Baseline Model 1Real interest rate = 8.13% Productivity growth rate =3.01% Baseline Model 2Same as Baseline Model 1 except population age structure in 2005 remains the same for all years Baseline Model 3Same as Baseline Model 1 except the productivity growth rate = 1.5% Baseline Model 4Same as Baseline Model 2 except the productivity growth rate =1.5% Baseline Model 5Same as Baseline Model 1 except the interest rate = 12% Baseline Model 6Same as Baseline Model 2 except the interest rate = 12% Table 3: Sustainability of current fiscal policies: Basic results of baseline models")
16
ModelMain assumptionsComputed value of GI GDP growth rate (1) GDP growth rate (2) UHC Model 7Real interest rate = 8.13% Productivity growth rate =3.01% 360.99437.98 UHC Model 2Same as UHC Model 1 except that population age structure in 2005 remains the same for all years 242.66 UHC Model 3Same as UHC Model 1 except that the productivity growth rate =1.5% 465.47561.62 UHC Model4Same as Baseline Model 2 except that the productivity growth rate =3.01% 470.51 UHC Model 5Same as Baseline Model 1 except the interest rate = 10% 525.25632.00 UHC Model 6Same as Baseline Model 2 except the interest rate = 10% 561.41 Table 4: Sustainability of current fiscal policies under a UHC for India
 GDP growth rate (2) UHC Model 7Real interest rate = 8.13% Productivity growth rate =3.01% UHC Model 2Same as UHC Model 1 except that population age structure in 2005 remains the same for all years UHC Model 3Same as UHC Model 1 except that the productivity growth rate =1.5% UHC Model4Same as Baseline Model 2 except that the productivity growth rate =3.01% UHC Model 5Same as Baseline Model 1 except the interest rate = 10% UHC Model 6Same as Baseline Model 2 except the interest rate = 10% Table 4: Sustainability of current fiscal policies under a UHC for India")
17
Sensitivity of sustainability Is fiscal sustainability sensitive to health expenditure projections? Assumptions on generosity of public expenditure on social welfare expenditure and/or health expenditure?

18
ModelMain assumptionsComputed value of GI UHC (MM) Model 1Productivity growth rate=3.01% Real interest rate = 8.13% -37 UHC (MM) Model 2Same as MM Model 1 except that the productivity rate is reduced to 1.5% 80 UHC (MM) Model 3Same as Baseline Model 2 and the interest rate = 10% 70 Table 5: Sustainability of current fiscal policies under MM health expenditure projections for India
 Model 1Productivity growth rate=3.01% Real interest rate = 8.13% -37 UHC (MM) Model 2Same as MM Model 1 except that the productivity rate is reduced to 1.5% 80 UHC (MM) Model 3Same as Baseline Model 2 and the interest rate = 10% 70 Table 5: Sustainability of current fiscal policies under MM health expenditure projections for India")
19
Generation’s age in 2004-05 Net payments (INR in ‘000) 0 (New born)311.239 5316.138 10310.317 15301.615 20288.879 25279.871 30256.717 35232.287 40207.989 45182.529 50156.851 55130.435 60101.562 6575.658 7053.188 7537.941 8028.418 8515.378 9015.762 Table 6: Generational Accounts and its composition based on Mason-Miller health care expenditure projections for India,
 0 (New born) Table 6: Generational Accounts and its composition based on Mason-Miller health care expenditure projections for India,")
20
Composition (INR in ‘000) Transfers Payments Education Health Cash Income tax Corporation tax Indirect taxes Non-tax revenues -28.067-7.451-16.74728.96255.365224.80554.371 -27.964-8.020-19.34230.42359.412226.04055.589 -24.021-8.618-22.61330.93561.771218.14154.722 -18.001-9.136-27.58931.41464.475207.09753.354 -9.810-9.603-34.60331.55867.694192.28051.364 -0.064-10.097-34.11230.79070.756174.07748.522 -0.054-10.360-36.16928.67572.527156.72345.376 -0.045-10.263-37.68525.50772.033140.80241.937 -0.036-9.873-37.54621.75269.545125.94138.206 -0.027-9.162-36.81617.39866.631110.31134.194 -0.018-8.256-35.06212.78163.82593.65329.929 -0.010-7.224-35.2738.13461.38777.49425.927 -0.002-5.914-35.6533.88055.55462.22221.475 0.000-4.687-36.3622.26646.57150.26217.608 0.000-3.453-35.7171.40736.87539.97814.098 0.000-2.206-33.2340.80329.99431.01911.564 0.000-1.079-26.1740.43822.46123.2899.483 0.000-0.174-21.2470.22312.10418.1226.350 0.000-0.159-14.7810.0999.15115.6845.608 Table 6: Generational Accounts and its composition based on Mason-Miller health care expenditure projections for India,
 Transfers Payments Education Health Cash Income tax Corporation tax Indirect taxes Non-tax revenues Table 6: Generational Accounts and its composition based on Mason-Miller health care expenditure projections for India,")
21
Future generation197.569 Generational imbalance (%)-37.00 Sustainability gap (%)-9.10 Net payments as % of lifetime income 1.1. Current (newborn) generation 27.70 1.2. Future generation 11.60 Table 6: Generational Accounts and its composition based on Mason-Miller health care expenditure projections for India,
 generation Future generation Table 6: Generational Accounts and its composition based on Mason-Miller health care expenditure projections for India,.")
22
Required adjustments by tax burden and transfer payments GenerationsTax adjustment (%)Tax and transfer adjustment (%) Current generation -388.0-185.9 Future generation -45.4-39.5 2010 -41.8-33.7 2020 -43.0-35.0 2030 -44.1-36.4 Table 6: Generational Accounts and its composition based on Mason-Miller health care expenditure projections for India,
Tax and transfer adjustment (%) Current generation Future generation Table 6: Generational Accounts and its composition based on Mason-Miller health care expenditure projections for India,")
23
IndicatorsBaseline Model 1UHC Model 1 Generational imbalance (%) 97.75360.99 Sustainability gap (%) 1.986.26 Net payments as % of lifetime income 1.1. Current (newborn) generation11.34.9 1.2. Future generation14.9 Required adjustments by tax burden and transfer payments GenerationsTax adjustment (%) Tax and transfer adjustment (%) Tax adjustment (%) Tax and transfer adjustment (%) Current generation 255.0162.7804.7453.5 Future generation 11.57.336.419.9 2010 11.17.035.119.2 2020 11.27.135.419.4 2030 11.37.235.719.6 Table 7: Required adjustments in unsustainability scenarios, India
 generation Future generation14.9 Required adjustments by tax burden and transfer payments GenerationsTax adjustment (%) Tax and transfer adjustment (%) Tax adjustment (%) Tax and transfer adjustment (%) Current generation Future generation Table 7: Required adjustments in unsustainability scenarios, India.")
24
Sensitivity for generosity of public expenditure We recalculated the GA models in Table 1 for different values of income elasticity of public expenditure on health. Our findings suggest that if the policy makers set this elasticity at 0.64 or less for all the baseline models 1 and 0.75 or less for all the baseline models 2 in Table 1. On the other hand, UHC models need simultaneous adjustments in income elasticity of public expenditure on social welfare expenditure and health expenditure. In particular, UHC models 1 (2) require adjustments for income elasticity of social welfare expenditure at 0.70 (0.90) or below and health expenditure at 0.40 (0.3 5) or less.
 require adjustments for income elasticity of social welfare expenditure at 0.70 (0.90) or below and health expenditure at 0.40 (0.3 5) or less..")
25
Major conclusions and implications The methodology of NTA, MM health expenditure projections and GA are useful to offer new insights in to the current policy proposals on UHC in India. These insights include: Age specific demand for health expenditure/consumption Measurement of UHC in terms of age profile of total health consumption Impact of age structure transition on demand for health services in general and UHC in particular Determination of fiscal sustainability by current and projected public health expenditure Determination of fiscal sustainability in the context of expected reform on UHC Developing plausible options for consideration for policy makers

26
THANK YOU

Similar presentations


 Adjusting inflationary gaps Stagflation A growing economy A role for stabilization policy.>")


 in Bangladesh Md. Ashadul Islam Director General Health Economics Unit Ministry of Health and.>")
