Download presentation
Presentation is loading. Please wait.

1
UNRWA FINANCIAL REPORT End- May 2011

2
2 Month Variances Donor income – unfavourable by -$19.8m – all timing variance. PSC favourable by $1m, increased project activity, hence E EOY forecast increased by $1m to $21m. Area labour costs unfavourable by -$1.6m – timing due to increases in: i)LDC & Temporary staff by -$0.4m, ii) CAF by -$1.7m, & other labour savings + $0.5m. Inventory and non-inventory supplies unfavourable by -$0.9m - timing, Admin support Services unfavourable by -$0.4m – timing variance Cash subsidies to hardship cases unfavourable by $-$0.5m – timing variance Year To Date Variances Donor income – unfavourable by -$46.8m due to timing variance – budgeted income not yet received incl. EU ($39m), USA ($11m) and receipts higher than budgeted incl. Sweden $3m. Area labour costs unfavourable by -$3.6m: Basic salary favourable by $1m, retirement benefits unfavourable by -$0.2m, Health related expenses favourable by $1.6m, annual leave accrual unfavourable by -$0.8m, CAF unfavourable by -$5m due to lower actual rate of NIS to budget more than offset by lower labour costs due to delayed appointment of staff. Non labour costs favourable by $29.1m, due to incorrect profiling of Reserves spend – all timing variance End of Year Forecast Initial budget deficit was -$63.0m, currently forecast to end of year at -$63.0m. The higher than forecast income + $7.3m (donor + $5.2m, PSC + other +$2.1m), equally offset by forecast higher expenses: CAF, provisions and derivatives. Movement in end of Year Forecast End of Year (EOY) forecast at April was -$64.7m, which is currently forecast at -$63.0m, a favourable movement of $1.7m, principally comprising: a) increase in PSC forecast +$1.0m, b) net FX gain +$2.0m, c) Increase forecast KSA income + $2.2m, and partially offset by: d) salary increases for Syria and Lebanon field -$3.4m and other -$0.2m. May 2011 General Fund Financial Summary
LDC & Temporary staff by -$0.4m, ii) CAF by -$1.7m, & other labour savings + $0.5m. Inventory and non-inventory supplies unfavourable by -$0.9m - timing, Admin support Services unfavourable by -$0.4m – timing variance Cash subsidies to hardship cases unfavourable by $-$0.5m – timing variance Year To Date Variances Donor income – unfavourable by -$46.8m due to timing variance – budgeted income not yet received incl. EU ($39m), USA ($11m) and receipts higher than budgeted incl. Sweden $3m. Area labour costs unfavourable by -$3.6m: Basic salary favourable by $1m, retirement benefits unfavourable by -$0.2m, Health related expenses favourable by $1.6m, annual leave accrual unfavourable by -$0.8m, CAF unfavourable by -$5m due to lower actual rate of NIS to budget more than offset by lower labour costs due to delayed appointment of staff. Non labour costs favourable by $29.1m, due to incorrect profiling of Reserves spend – all timing variance End of Year Forecast Initial budget deficit was -$63.0m, currently forecast to end of year at -$63.0m. The higher than forecast income + $7.3m (donor + $5.2m, PSC + other +$2.1m), equally offset by forecast higher expenses: CAF, provisions and derivatives. Movement in end of Year Forecast End of Year (EOY) forecast at April was -$64.7m, which is currently forecast at -$63.0m, a favourable movement of $1.7m, principally comprising: a) increase in PSC forecast +$1.0m, b) net FX gain +$2.0m, c) Increase forecast KSA income + $2.2m, and partially offset by: d) salary increases for Syria and Lebanon field -$3.4m and other -$0.2m. May 2011 General Fund Financial Summary.")
3
3 May 2011 Income Statement, General Fund - Resources US$ m

4
May 2011 Income Statement, General Fund – Resources (Page1 of 2) 4
 4")
5
May 2011 Income Statement, General Fund – Resources (Page 2 of 2) 5
 5")
6
May 2011 GF Donor Income – YTD and E EOY US$ m 6

7
UNRWA Bank Balances – May 2011 7

8
UNRWA Foreign Exchange gains and losses for 2011 to-date are made up of the following: FX Gain/Loss on Donor Income –The difference between the fixed Budget Rates and the UN exchange rate multiplied by the forecasted Donor Income amount. –The result to date is a gain of $8.5m, due to an appreciation of most currencies against the USD. –Given that 97% of non-USD GF income is hedged, the above gain or loss is offset by an equal and opposite gain or loss on the Financial Derivatives for GF (ie a net FX impact at 31 May of ($0.1m). Financial Derivatives Gains/(Losses) –In 2010/11, hedging contracts (FX Forwards) were entered into to protect the value of budgeted GF and Project 2011 contributions. –The E EOY loss on these contracts reported is ($8.6m) for GF and ($0.3) for Projects. Other Exchange Gains/(Losses) –The revaluation of Foreign Currency bank balances and any other assets or liabilities, and the realised gain or loss on any foreign currency transactions. –The result YTD was a gain of $1.9m. This result is expected to remain minimal as foreign currency bank balances are now kept to a minimum - non-USD receipts are converted to USD immediately after receipt. Treasury – Foreign Exchange Result – May 2011 8
. Financial Derivatives Gains/(Losses) –In 2010/11, hedging contracts (FX Forwards) were entered into to protect the value of budgeted GF and Project 2011 contributions. –The E EOY loss on these contracts reported is ($8.6m) for GF and ($0.3) for Projects. Other Exchange Gains/(Losses) –The revaluation of Foreign Currency bank balances and any other assets or liabilities, and the realised gain or loss on any foreign currency transactions. –The result YTD was a gain of $1.9m. This result is expected to remain minimal as foreign currency bank balances are now kept to a minimum - non-USD receipts are converted to USD immediately after receipt. Treasury – Foreign Exchange Result – May")
9
2011 Cash Flow Forecast - General Fund – May 2011 9

10
E EOY Income to Cash Flow Reconciliation – May 2011 10

11
GF Cash Flow Statement for May 2011 11

12
12

13
13 General Fund – May 2011 US$ m

14
14 APPENDICES Financial Performance Report by Sub Programme Financial Performance Report by HDG (Objective) Balance Sheet as per UNSAS – As at 31 May 2011 YTD Dec and EOY General Fund – Cash Inflow Cash Flow Statements as on 31 May 2011 Supplier Aging as on 31 May 2011 Head Count as on 31 May 2011
 Balance Sheet as per UNSAS – As at 31 May 2011 YTD Dec and EOY General Fund – Cash Inflow Cash Flow Statements as on 31 May 2011 Supplier Aging as on 31 May 2011 Head Count as on 31 May 2011")
15
15

16
16

17
17

18
18

19
19

20
20

21
21

22
May 2011 GF – Donor Cash Inflows YTD and E EOY US$ m

23
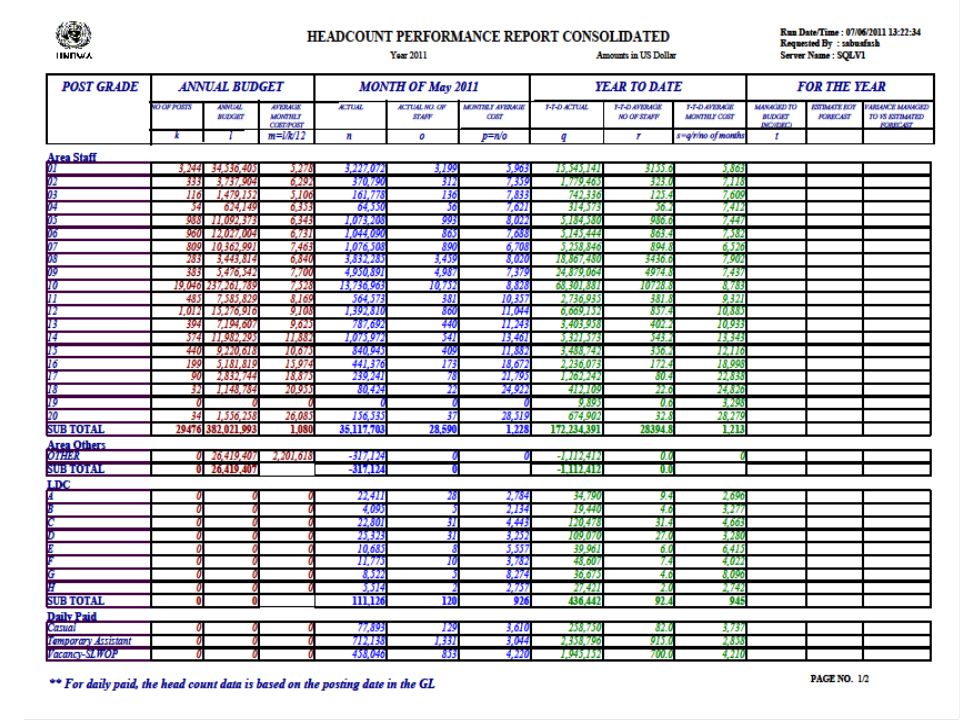
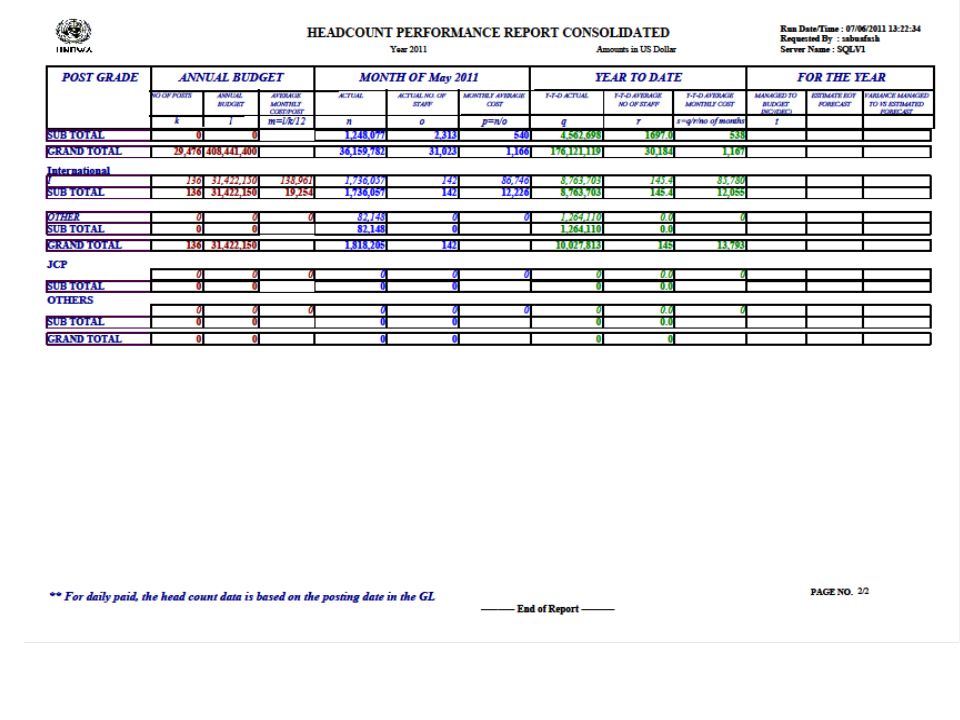
23 Head Count as at End of May 2011 – Area Staff Budget

26
Supplier’s Accounts Payable & Advances – May 2011

27
27

Similar presentations