Download presentation
Presentation is loading. Please wait.

1
Children With Disabilities Study: Special Education in the Context of School Reform Commissioned by the Rhode Island General Assembly in July 1999

2
Rhode Islands Proud History Responsive to the educational needs of all students including those with disabilities: 1952 - State legislation requiring special education 1952 - State legislation requiring special education 1963 - General Assembly establishes 1 st commission to study needs of students with disabilities 1963 - General Assembly establishes 1 st commission to study needs of students with disabilities 1963 - One of the 1 st states to adopt special education regulations 1963 - One of the 1 st states to adopt special education regulations 1975 – IDEA enacted by federal government 1975 – IDEA enacted by federal government 1994 – ALL KIDS Agenda 1994 – ALL KIDS Agenda 1996 – Comprehensive Education Strategy 1996 – Comprehensive Education Strategy 1997 – Article 31 & School Improvement 1997 – Article 31 & School Improvement 1998 – Article 31 R & School Accountability 1998 – Article 31 R & School Accountability

3
2000 - Article 23 Requires consideration of students with disabilities in RI School Improvement Children with Disabilities Study Children with Disabilities Study »To examine special education in the context of school reform »Designed to provide information about children with disabilities and their special education programs in ways that inform the strategic and school improvement process

4
Children With Disabilities Study Requires investigation of 4 areas: Identify factors that influence disproportionate designation of students as disabled and their special education programming Identify factors that influence disproportionate designation of students as disabled and their special education programming Describe performance on state assessments Describe performance on state assessments Identify graduation rates, employment status, independent living, participation in post secondary education and influential factors Identify graduation rates, employment status, independent living, participation in post secondary education and influential factors Examine federal and state special education funding Examine federal and state special education funding

5
Results of the Study Summarized under 3 broad headings: Accomplishments Accomplishments Challenges Challenges Forging Ahead Forging Ahead

6
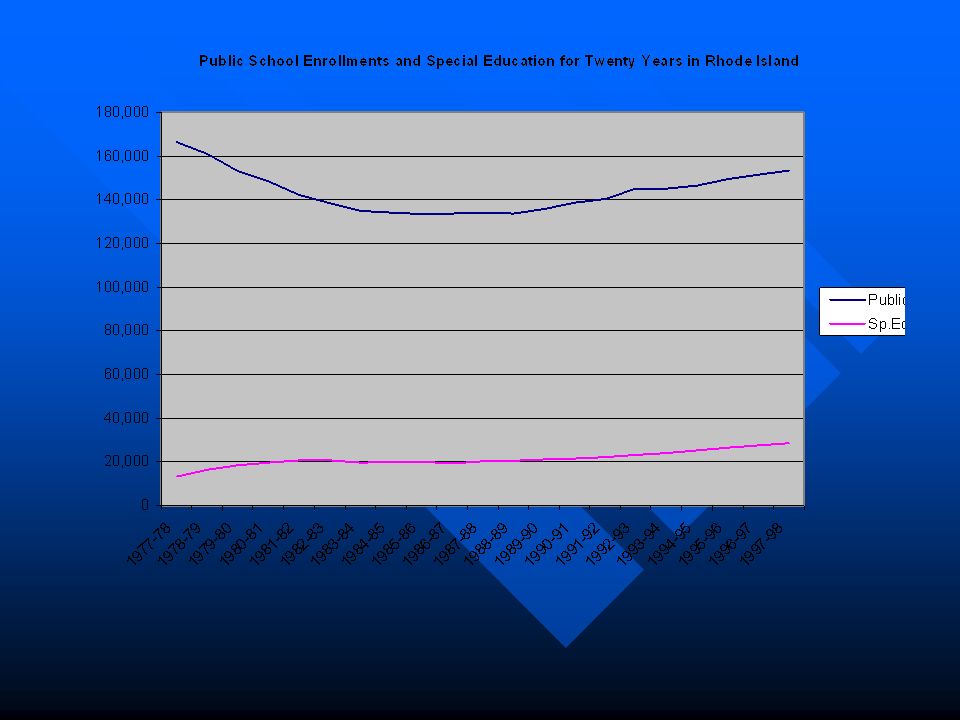
Accomplishments RI has made much progress: Access to public education Access to public education 1977 – 13,184 2001 – 31,616 1977 – 13,184 2001 – 31,616 Accountabilitythrough assessment Accountability through assessment Students with disabilities in RI State Assessment Students with disabilities in RI State Assessment Unified system of school improvement Unified system of school improvement Close equity gaps associated with disability Close equity gaps associated with disability Exiting special education Exiting special education 60% exit for two reasons 60% exit for two reasons Graduation rates Graduation rates 67% students with disabilities 77% students without 67% students with disabilities 77% students without Post school outcomes from pilot study Post school outcomes from pilot study 70% employed 22% in post secondary ed or training 70% employed 22% in post secondary ed or training Special education contribution Special education contribution More than half of the total expenditures fund direct instruction and related services More than half of the total expenditures fund direct instruction and related services

9
Challenges RI has made much progress but faces new challenges: Over identification Over identification In 97-98 RI designated more of its students disabled than any other state in the nation In 97-98 RI designated more of its students disabled than any other state in the nation LD & speech/lang account for 75% of students identified LD & speech/lang account for 75% of students identified Low achievement vs. true disability (80% read, R. Lyon) Low achievement vs. true disability (80% read, R. Lyon) Most students identified in grades 3 and 4 Most students identified in grades 3 and 4 Measuring performance on state assessments Measuring performance on state assessments Accuracy of participation rates and mobility issues Accuracy of participation rates and mobility issues Special education & district strategic plans Special education & district strategic plans Special education data collection & drop out rate Special education data collection & drop out rate Reliability of multiple data systems - gaps, inconsistencies Reliability of multiple data systems - gaps, inconsistencies 2-tier system to measure post school outcomes 2-tier system to measure post school outcomes Expenditures for special education Expenditures for special education Federal funding = 10.2% Federal funding = 10.2% RI SEEP results RI SEEP results
 Low achievement vs. true disability (80% read, R. Lyon) Most students identified in grades 3 and 4 Most students identified in grades 3 and 4 Measuring performance on state assessments Measuring performance on state assessments Accuracy of participation rates and mobility issues Accuracy of participation rates and mobility issues Special education & district strategic plans Special education & district strategic plans Special education data collection & drop out rate Special education data collection & drop out rate Reliability of multiple data systems - gaps, inconsistencies Reliability of multiple data systems - gaps, inconsistencies 2-tier system to measure post school outcomes 2-tier system to measure post school outcomes Expenditures for special education Expenditures for special education Federal funding = 10.2% Federal funding = 10.2% RI SEEP results RI SEEP results.")
10
Table One Percentage of Children Age 6-21 Served Under IDEA, Part B 1995-19961996-19971997-1998 Rhode Island11.2611.7312.08 50 states and D.C. 8.508.628.75 Difference between 50 states/D.C. and RI 2.763.113.33

11
Special Education Expenditure Estimates Across SEEP States and the Nation, Ages 3-22 1999–00[1][1] State AState B State CState DState E Rhode IslandState FState GState HU.S.[2][2] Special Education Expenditure per Special Education Student $6,015$5,459$6,466$6,540$7,511$10,19$11,839$12,31$18,105$8,080 General Education Expenditure per Special Education Student $4,351$4,962$4,635$4,706$3,860$5,410$5,637$5,215$2,994$4,394 Total (Special and General) Education Expenditure per Special Education Student $10,366$10,421$11,101$11,246$11,371$15,60$17,476$17,52$21,099$12,47 [1][1] Includes the following services: Personnel, central office administration and support, school administration and support, assessment (school-aged only), non-personnel, fees and tuition for students placed in non-public institutions, homebound/hospital programs (school-aged only), summer school, capital, and transportation. [2][2] Source: Chambers, J., Parrish, T., and Harr, J. (2002).
![Special Education Expenditure Estimates Across SEEP States and the Nation, Ages –00[1][1] State AState B State CState DState E Rhode IslandState FState GState HU.S.[2][2] Special Education Expenditure per Special Education Student $6,015$5,459$6,466$6,540$7,511$10,19$11,839$12,31$18,105$8,080 General Education Expenditure per Special Education Student $4,351$4,962$4,635$4,706$3,860$5,410$5,637$5,215$2,994$4,394 Total (Special and General) Education Expenditure per Special Education Student $10,366$10,421$11,101$11,246$11,371$15,60$17,476$17,52$21,099$12,47 [1][1] Includes the following services: Personnel, central office administration and support, school administration and support, assessment (school-aged only), non-personnel, fees and tuition for students placed in non-public institutions, homebound/hospital programs (school-aged only), summer school, capital, and transportation.](http://images.slideplayer.com/2/716613/slides/slide_11.jpg "[2][2] Source: Chambers, J., Parrish, T., and Harr, J. (2002)..")
12
Forging Ahead Its not enough to be good if you have the ability to be better: Unified special & general ed approach to reform Unified special & general ed approach to reform Prevention and intervention Prevention and intervention Provide high quality reading in general education Provide high quality reading in general education Early intervention Early intervention Professional development Professional development Increase capacity of general educators to provide research based, intensive instruction for all who perform at unacceptably low academic levels to better serve all students Increase capacity of general educators to provide research based, intensive instruction for all who perform at unacceptably low academic levels to better serve all students Identification criteria for LD & speech/language Identification criteria for LD & speech/language Lack of appropriate instruction in reading or math (IDEA) Lack of appropriate instruction in reading or math (IDEA) Comprehensive, reliable data collection system Comprehensive, reliable data collection system Single, unified system with individual student identifier Single, unified system with individual student identifier Expenditures for special education Expenditures for special education Expenditure multiplied by # of students Expenditure multiplied by # of students Research based prevention & early intervention Research based prevention & early intervention Study disabilities severely compromising function Study disabilities severely compromising function
 Lack of appropriate instruction in reading or math (IDEA) Comprehensive, reliable data collection system Comprehensive, reliable data collection system Single, unified system with individual student identifier Single, unified system with individual student identifier Expenditures for special education Expenditures for special education Expenditure multiplied by # of students Expenditure multiplied by # of students Research based prevention & early intervention Research based prevention & early intervention Study disabilities severely compromising function Study disabilities severely compromising function")
13
NCLB and New Era Report Themes No child w/disabilities left behind No child w/disabilities left behind Increase Accountability Increase Accountability Emphasize Results Emphasize Results Provide Flexibility Provide Flexibility Empower Parents and their Choices Empower Parents and their Choices

14
Interfaces with Rhode Island Report Improving results (achievement, post- school outcomes) are the keys to increased public support and resources. Improving results (achievement, post- school outcomes) are the keys to increased public support and resources. Rhode Island fails to prevent many children from developing high incidence disabilities Rhode Island fails to prevent many children from developing high incidence disabilities Rhode Island needs a much better, centrally-accessible data system that can be validated. Rhode Island needs a much better, centrally-accessible data system that can be validated.
 are the keys to increased public support and resources. Rhode Island fails to prevent many children from developing high incidence disabilities Rhode Island fails to prevent many children from developing high incidence disabilities Rhode Island needs a much better, centrally-accessible data system that can be validated. Rhode Island needs a much better, centrally-accessible data system that can be validated..")
15
Our Challenge Right Right Children Services Time Settings Personnel Results Think about this

Similar presentations