Download presentation
Presentation is loading. Please wait.

1
Library Quality Assessment through LibQUAL+ ® IATUL 2009 Leuven, Belgium June 2, 2009 Presented by Martha Kyrillidou Director, Statistics and Service Quality Programs Association of Research Libraries

2
Universal Values

3
LibQUAL+ ™ Premise “Il est plus nécessaire d'étudier les hommes que les livres” —FRANÇOIS DE LA ROCHEFOUCAULD

4
PERCEPTIONS SERVICE “….only customers judge quality; all other judgments are essentially irrelevant” Note. Zeithaml, Parasuraman, Berry. (1999). Delivering quality service. NY: The Free Press. SERVQUAL
. Delivering quality service. NY: The Free Press. SERVQUAL.")
5
Multiple Methods of Listening to Customers Transactional surveys* Mystery shopping New, declining, and lost-customer surveys Focus group interviews Customer advisory panels Service reviews Customer complaint, comment, and inquiry capture Total market surveys* Employee field reporting Employee surveys Service operating data capture Note. A. Parasuraman. The SERVQUAL Model: Its Evolution And Current Status. (2000). Paper presented at ARL Symposium on Measuring Service Quality, Washington, D.C. *A SERVQUAL-type instrument is most suitable for these methods
. Paper presented at ARL Symposium on Measuring Service Quality, Washington, D.C. *A SERVQUAL-type instrument is most suitable for these methods.")
6
LibQUAL+ ® Dimensions: What do they measure?

7
Survey Structure: What We Ask Library Users

8
LibQUAL+ ®

9
Digital Assessment fuel for creativity In the 21 st century world, the power of digital information to catalyze progress is limited only by the power of the human mind. Data are not consumed by the ideas and innovations they spark but are an endless fuel for creativity. - Harnessing the power of digital data for science and society (January 2009)
.")
10
Community Languages –Afrikaans –American English –British English –Chinese –Danish –Dutch –Finnish –French –German –Japanese –Norwegian –Spanish –Swedish –Welsh Consortia *Each may create 5 local questions to add to their survey Countries –Australia, Canada, Denmark, Egypt, Finland, France, Hong Kong, Ireland, New Zealand, the Netherlands, Norway, South Africa, Sweden, Switzerland, UAE, U.K., U.S. Types of Institutions –Academic Health Sciences –Academic Law –Academic Military –College or University –Community College –Electronic –European Business –European Parliament –Family History –Research Centers (FFRDC) Libraries –High School –Hospital –National Health Service England –Natural Resources –New York Public –Public –Smithsonian –State –University/TAFE
 Libraries –High School –Hospital –National Health Service England –Natural Resources –New York Public –Public –Smithsonian –State –University/TAFE.")
11
European Participation by Country Country200020012002200320042005200620072008Total Belgium 33 Denmark 1 2 47 Finland 2 810 France 1 2148 Ireland 11211 6 Netherlands 11 5 18 Norway 2 46 Sweden 3442316 Switzerland 2 2 15 UK 201716332118125

12
European Participation by Type BelgiumDenmarkFinlandFranceIrelandNetherlandsNorwaySwedenSwitzerlandUK College or University 1 2454 83 66 Electronic 1 European Business 2462114332 European Parliament 2 FFRDC 3 Hospital 3 1 National Health Service England 10

13
Benefits of Using LibQUAL+ ® Standardization across institution types Benchmarking capabilities Streamlined processes through Web interface Alleviates costs and staff time associated with survey design and develop Can be used with other assessment tools (i.e., localized surveys)
")
14
Results Notebooks Sections for Overall, Undergraduates, Graduates, Faculty, Staff, Library Staff include: –Demographic Summary –Core Questions Summary –Dimensions Summary –Local Questions –General Satisfaction Questions –Information Literacy Outcomes Questions –Library Use Summary Appendix describing changes in the dimensions and the questions included in each dimension.

15
DO YOU UNDERSTAND YOUR RESULTS?

16
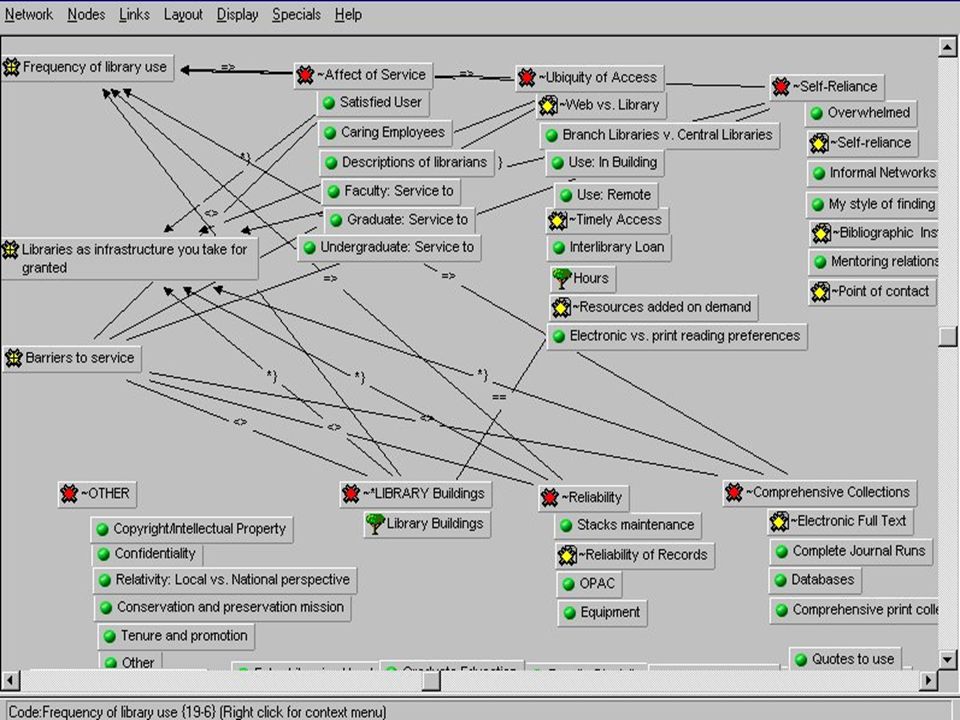
Qualitative Analysis: User Comments About one-half of users include comments on their surveys User Comments available on the LibQUAL+ ® Web site –Download comments in Excel or text file Skim the comments Conduct content analysis (e.g. ATLAS.ti)
.")
17
Comments Why the Box is so Important: –About half of participants provide open-ended comments, and these are linked to demographics and quantitative data. –Users elaborate the details of their concerns. –Users feel the need to be constructive in their criticisms, and offer specific suggestions for action.

18
LoadedPT:P1:01xxxxxxxxxxxxxx.txt,S:\Admin\Colleen\ServQual Interviews\TEXT Only\01xxxxxxxxx.txt (redirected: c:\zz\atlasti\fred

20
ALL COMMENTS - 2009 Texas A&M LibQUAL+ ® Survey Word Clouds (www.wordle.net) Source: Colleen Cook, Presented at QQML 2009 in Chania

21
Interpreting LibQUAL+® Service Quality Data Three Interpretation Frameworks

22
Benchmarking Against Peer Institutions --1,000,000 Users; 1,000 Institutions! NORMS! NORMS! NORMS! Interpretation Framework #1

23
Score Norms Norm Conversion Tables facilitate the interpretation of observed scores using norms created for a large and representative sample. LibQUAL+® norms have been created at both the individual and institutional level

24
Institutional Norms for Perceived Means on 25 Core Questions Note: Thompson, B. LibQUAL+ Spring 2002 Selected Norms, (2002).
..")
25
Peer Comparison Source: Jim Self, University of Virginia, Presented at Performance Measurement in Academic Libraries Workshop, EBLIP4, Durham, North Carolina, May 11, 2007Performance Measurement in Academic Libraries

26
Benchmarking Against Self, Longitudinally “Nobody is more like me than me!” --Anonymous Interpretation Framework #2

27
Longitudinal Analysis Source: Deborah Poole, Four Years of LibQUAL+®. ALA Annual, New Orleans, LA, June 26 2006. Comparisons are powerful… And four years of data ROCKS!

28
Interpreting Perceived Scores Against Minimally-Acceptable and Desired Service Levels (i.e., “Zones of Tolerance”) Interpretation Framework #3
 Interpretation Framework #3")
29
Dimension Summary Key Term: Zone of Tolerance

30
UNDERGRADUATES - 2009 Texas A&M LibQUAL+ ® Survey Source: Colleen Cook, Presented at QQML 2009 in Chania

31
® LibQUAL+ ® Lite The measurement strategy we are about to describe, used in 'LibQUAL+ Lite,' could be used in ANY Web local survey with more than a few questions, to: (a)maximize response rate and (b)minimize burdens on respondents.
maximize response rate and (b)minimize burdens on respondents.")
32
® LibQUAL+ ® Lite ® LibQUAL+ ® Lite is a survey methodology in which (a) ALL users answer a few, selected survey questions, but (b) the remaining survey questions are answered ONLY by a randomly- selected subsample of the users. Thus, (a) data are collected on ALL QUESTIONS, but (b) each user answers FEWER QUESTIONS, thus shortening the required response time!!!
 data are collected on ALL QUESTIONS, but (b) each user answers FEWER QUESTIONS, thus shortening the required response time!!!.")
33
® LibQUAL+ ® Lite Person Item BobMaryBillSueTed Service Affect #1 X X X X X Info Control #1 X X X X X Service Affect #2 X X Library as Place #1 X X X X X Service Affect #3 X X Info Control #2 X X Library as Place #2 X X

34
Comparisons of Library Users Expectations and Perceptions Across North American, European, African, Asian and Australian Libraries

35
Expansion of LibQUAL+ ® : No. of Institutions by Country Survey Country200320042005200620072008 Australia 26231 Bahamas 1 Belgium 2 Canada991511718 Denmark 1 (EBSLG) 2 4 Egypt 1 1 Finland 4 (EBSLG) 8 France 2 (EBSLG) 2 14 Hong Kong 11 Ireland 1 (EBSLG)1211 Mexico 11 Netherlands12 (EBSLG) 5 New Zealand 131 Norway 2 (EBSLG) 4 South Africa 11859 Sweden 7 (EBSLG)4223 Switzerland 2 (EBSLG) 2 United Arab Emirates 1 1 United Kingdom201615332212 USA27816019522216293
 2 4 Egypt 1 1 Finland 4 (EBSLG) 8 France 2 (EBSLG) 2 14 Hong Kong 11 Ireland 1 (EBSLG)1211 Mexico 11 Netherlands12 (EBSLG) 5 New Zealand 131 Norway 2 (EBSLG) 4 South Africa Sweden 7 (EBSLG)4223 Switzerland 2 (EBSLG) 2 United Arab Emirates 1 1 United Kingdom USA")
36
Expansion of LibQUAL+ ® : No. of Institutions by Language Survey Language200320042005200620072008 Afrikaans 41 4 American English285172206236217102 British English202331503836 Chinese (Traditional) 4 Danish 1 2 Dutch 1 2 Finnish 1 2 French (Canada)214 231 French (Europe) 1 1 5 German 1 Norwegian 1 2 Spanish 1 Swedish 5211 Swedish (BE) 1 2 Welsh 1
 4 Danish 1 2 Dutch 1 2 Finnish 1 2 French (Canada) French (Europe) German 1 Norwegian 1 2 Spanish 1 Swedish 5211 Swedish (BE) 1 2 Welsh 1.")
37
Expansion of LibQUAL+ ® : No. of Users by Country Survey Country200320042005200620072008 Australia 33761530030395467530 Bahamas 122 Belgium 426 Canada4698569086458451473885322 Denmark 377 1005 2372 Egypt 492 326 Finland 2146 3805 France 401 3385776100 Hong Kong 14516 Ireland 177291370310631040 Mexico 1086777 Netherlands735368 1922 New Zealand 3065843541 Norway 571 500 South Africa 9318350932176442 Sweden 25081645234512111024 Switzerland 1161 872 United Arab Emirates 415 610 United Kingdom11329148581621119608172689405 USA10344174659911041193309373161580

38
Perceptions by Country: Mean Scores Survey Country200320042005200620072008 Australia 6.516.786.826.866.88 Bahamas 6.43 Belgium 7.01 Canada6.816.776.936.887.047.05 Denmark 6.38 6.48 6.57 Egypt 6.53 6.67 Finland 6.82 6.84 France 6.73 5.956.13 Hong Kong 6.65 Ireland 5.966.037.086.506.69 Mexico 7.507.69 Netherlands6.66 6.68 New Zealand 7.05 6.79 Norway 6.79 6.71 South Africa 6.686.406.346.86 Sweden 6.286.596.606.246.64 Switzerland 6.51 6.62 United Arab Emirates 6.83 7.10 United Kingdom6.596.446.586.716.766.66 USA7.117.017.027.147.187.19

39
Perceptions by Country: Dimension Mean Scores 2004-08 20042005200620072008 CountryASICLPASICLPASICLPASICLPASICLP Australia6.596.696.066.816.916.506.916.906.506.896.946.636.827.086.64 Bahamas 6.776.206.17 Belgium 7.386.706.75 Canada6.936.876.297.096.996.507.076.926.447.207.086.687.227.106.64 Denmark6.746.655.21 6.976.775.12 6.636.786.08 Egypt6.63 6.18 6.896.706.25 Finland 6.956.946.35 6.986.906.44 France7.026.875.93 7.116.955.716.086.055.606.156.265.90 Hong Kong 6.586.716.65 Ireland6.206.105.346.266.225.337.466.976.506.766.525.966.706.746.55 Mexico 7.617.487.347.877.647.46 Netherlands6.826.875.96 6.716.856.32 New Zealand 7.147.106.757.127.166.747.046.886.07 Norway 7.036.726.44 7.016.676.22 South Africa 6.706.726.596.546.356.236.436.386.086.876.836.85 Sweden6.696.135.666.866.685.946.716.666.316.496.255.756.936.716.02 Switzerland6.766.775.65 6.837.035.59 United Arab Emirates7.066.886.34 7.16 6.92 United Kingdom6.596.575.976.706.676.196.876.806.256.85 6.446.776.826.18 USA7.087.046.807.087.066.817.217.176.947.227.207.057.23 7.01

40
Perceptions by Language: Dimension Mean Scores 2004-08 20042005200620072008 LanguageASICLPASICLPASICLPASICLPASICLP Afrikaans 6.966.806.927.417.026.85 7.137.047.17 American English7.077.026.767.087.066.797.207.156.917.217.166.947.247.236.99 British English6.576.565.906.726.766.336.846.766.286.816.846.506.776.796.33 Chinese (Traditional) 6.536.716.66 Danish 6.976.765.09 6.596.756.04 Dutch6.866.845.89 6.676.846.29 Finnish 7.016.966.41 7.277.096.55 French (Canada)6.866.716.147.236.956.13 7.227.076.737.977.577.65 French (Europe)7.167.016.06 7.166.975.77 6.176.275.92 German 6.837.035.58 Norwegian 7.046.706.42 7.016.636.23 Spanish 7.877.647.46 Swedish6.686.115.646.856.685.926.706.666.306.456.205.69 Swedish (BE) 6.666.826.04 7.016.826.15 Welsh 7.457.156.67
 Danish Dutch Finnish French (Canada) French (Europe) German Norwegian Spanish Swedish Swedish (BE) Welsh")
41
Collective consciousness needs assessment The emerging library user sees the need for a different kind of library – a library that serves as a source of information ready to be accessed any time, from anywhere, using modern technologies. Thompson, Kyrillidou & Cook, “Library Users’ Service Desires” Library Quarterly (2008) Assessment is now a critical skill for librarians. Kyrillidou & Cook, “The evolution of measurement and evaluation of libraries: a perspective from the Association of Research Libraries” Library Trends (2008)
 Assessment is now a critical skill for librarians. Kyrillidou & Cook, The evolution of measurement and evaluation of libraries: a perspective from the Association of Research Libraries Library Trends (2008).")
42
Digital Assessment power of a data set is amplified by ingenuity A few bits, well found, can drive a giant leap of creativity. The power of a data set is amplified by ingenuity through applications unimagined by the authors and distant from the original field. - Harnessing the power of digital data for science and society (January 2009)
.")
43
A conversation to be continued … Aug 17, 2009 Northumbria Conference in Florence, Italy 2010 IATUL Conference in Purdue Oct 25-27, 2010 Library Assessment Conference in BaltimoreOct 25-27, 2010 Library Assessment Conference in Baltimore

44
LibQUAL+ ® Resources LibQUAL+ ® Web site: http://old.libqual.org Publications: http://old.libqual.org/publications Events and Training: http://old.libqual.org/events Gap Theory/Radar Graph Introduction: http://old.libqual.org/Information/Tools/libqualpresentation.cfm LibQUAL+ ® Procedures Manual: http://old.libqual.org/Publications/index.cfm

Similar presentations


 Nanyang Technological University, Singapore April 4, 2006 Bruce Thompson.>")


 Annual Conference Washington, DC June 25, 2007 MaShana Davis and Martha Kyrillidou.>")
 Midwinter Meeting Philadelphia, PA January 14, 2008 Martha Kyrillidou, Director Statistics.>")
 Midwinter Meeting Seattle, WA January 22, 2007 MaShana Davis and Martha Kyrillidou.>")
