Download presentation
Presentation is loading. Please wait.

1
A Guide to Economic Indicators Chapter 5 Danielle Ko Trent Musso September 5, 2006

2
“Reliable” Indicators Economic indicators are considered reliable if: 1. They undergo minimal revision on average 2. They accurately signal turning points in the economic life cycle Consist of initial unemployment claims, average manufacturing workweek, non- farm payroll employment, hours worked, industrial production

3
The Reliables: Initial Unemployment Claims Most reliable indicator Measured as new claims for unemployment compensation under state programs Begin rising just over a year before the start of a recession Give a shorter warning period before an expansion

4
The Reliables: Average Manufacturing Workweek Released monthly by Bureau of Labor Statistics Accurate, clear pattern Manufacturers increase the workweek as demand rises, decrease the workweek as demand falls

5
The Reliables: Non-Farm Payroll Employment An employment statistic based on 250,000 non-farm establishments Released monthly by Bureau of Labor Statistics Preliminary reports are pretty accurate over time

6
The Reliables: Hours Worked Released monthly by Bureau of Labor Statistics Extremely accurate Generally increases at the beginning of recovery and early in revival Declines as the expansion matures

7
The Reliables: Industrial Production A measure of basic manufacturing health Estimates physical output of mines, factories, and utilities Moderate revisions over time Rises after revival phase begins As the U.S. becomes more of a service economy, may become less relevant

8
The Reliables: Help Wanted Advertising Measured by the Conference Board, a nonprofit private research organization Reflects relative level of the number of openings in existing and new jobs Uses data from classified sections of newspapers Rises at the beginning of expansion, falls as soon as expansion matures

9
Other High Quality Indicators Housing Starts & Building Permits Reflects the health of the housing market Housing markets among earliest indicators of change in economic life cycles Housing starts slightly less reliable than permits Starts vary because of weather conditions Permits can be filed regardless of weather Bottoming of housing market can indicate that start of an economic Revival

10
Other High Quality Indicators Composite Index of Leading Economic Indicators Includes 11 major components Initial unemployment claims, building permits, stock prices, consumer goods, etc. Useful in helping to signal economic changes Useful but considered overrated Takes into account extraordinary factors Strikes, severe weather, major stock price movements, etc.

11
The Unreliables Why? Extensive revisions Fail to reflect changing composition of U.S. economy Slow to incorporate faster growing, smaller firms that are taking market share from larger firms Federal budget cutbacks Limit ability to expand samples, process data, and improve accuracy

12
The Unreliables Retail Sales “Unreal Tale” Initial report is extensively revised Durable Goods Orders Include big-ticket Department of Defense contracts that are spread unevenly over the year, this skews the data Purchasing Managers Survey Ignores managers at fast growing smaller firms

13
The Unreliables Unemployment Rate Problems with rate calculations and includes such groups as teenagers Corporate Profits Reported late, 45 to 75 days after quarter end Consumer Sentiment Survey Not very practical and has not done well identifying phases in the economic cycle Reflects present conditions rather than future

14
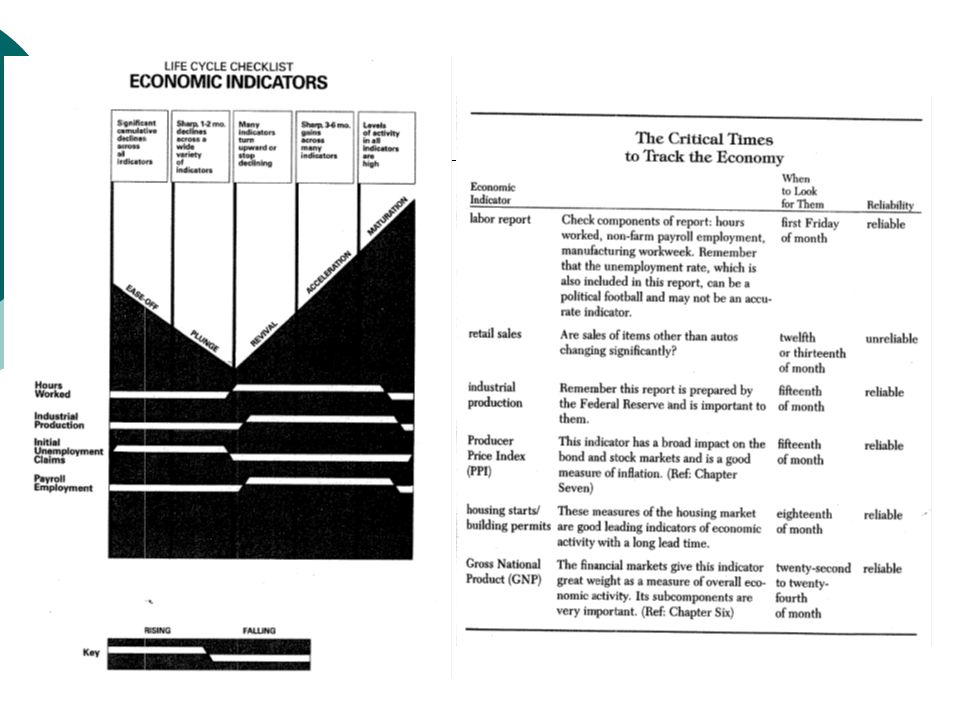
A Trip Through the Economic Life Cycle Revival Housing market, building permits, and housing starts to bottom out Initial unemployment claims fall Industrial production figures rise Acceleration Key indicators of Revival remain positive Business spending takes off Average manufacturing workweek drops

15
A Trip Through the Economic Life Cycle Maturation Building permits & housing starts fall Less help wanted advertising Leading economic indicators drop Significant increase in initial unemployment claims

16
A Trip Through the Economic Life Cycle Ease-off Major economic indicators show sharp negative trends, especially non-farm payroll unemployment, hours worked, manufacturing workweek, & industrial production Plunge Negative trends of ease-off continue First sign of recovery is increase in manufacturing workweek

18
Putting It All Together Where to look The Wall Street Journal, Business Conditions Digest Watch your step A matter of constant comparisons Revisions Understand terminology: real vs. nominal, seasonally adjusted Making your own adjustments

19
Making Final Investment Decisions Identify trends in individual indicators, compare to trends in other indicators Consider what kind of investor you are Economic indicators important in transition from Ease-off to Plunge! Economic understanding…and judgment!

Similar presentations
 Authority.>")
 = $11,814.9B (5.5%) Q2: GDP = $2,914.38.>")

 measures the dollar value of all goods and services produced in the U.S. economy in.>")


